Of course CAPEX will effect OPEX, or it should...or will it? The idea makes sense, however, at what point will a piece of equipment cost you more to maintain than it would cost to simply replace that piece of equipment? Should a refurbish be considered? How should a new plant be configured for the highest cost benefit? Not properly designing a system or not being willing to spend the money to replace equipment at the right interval could be costing you. By modelling your system in easy to use tools you can make logical decisions as well as justifying these decisions.
Author: jhynek
Webinar Upcoming Reliability Workbench Upgrades
The next version of Reliability Workbench (13.0.2) has now been released. Join us for this special preview webinar to get an early look at the new features that have been added. From changes to the report viewer interface, updated Prediction stands, data linking to the Allocation module, new DLL functions, expanded IEC 61508 calculations for both the Fault Tree and FMECA modules, a new Fault Tree failure model, and a brand-new results dialog for the FMECA module, complete with ISO 26262 functionality, there’s plenty to get excited about.
As always if you have any questions about our software please feel free to contact me.
Best Regards, Jeremy
jhynek@isograph.com
Friday the 13th Webinar: Reliability Workbench Upgrades 13.0.2
Although some might have superstitious feelings about Friday the 13th. We have chosen to hold a webinar to get you away from all the coffee talk. For Friday the 13th we have come up with a special preview of our next version of Reliability Workbench which is also version 13 (specifically 13.0.2). Join us for this special webinar, on Friday October 13th at 12 PM Eastern Time, to get an early look at the new features that have been added. We have added significant changes to the report viewer interface, updated Prediction stands, data linking to the Allocation module, new DLL functions, expanded IEC 61508 calculations for both the Fault Tree and FMECA modules, a new Fault Tree failure model, and a brand-new results dialog for the FMECA module, complete with ISO 26262 functionality. There's plenty to get excited about.
Please register by clicking: HERE
As always if you have any questions, comments or feedback please let me know.
Best Regards, Jeremy
jhynek@isograph.com
ISO 26262 Certified Software From Isograph
ISO 26262 Compliant Safety Analyses
Isograph is pleased to announce that Reliability Workbench FaultTree+ and FMECA modules have been tested by SGS-TÜV according to ISO 26262-8:2011 and certified as suitable for safety analyses up to ASIL D.
ISO 26262 (Road vehicles - Functional safety) is an adaptation of IEC 61508 for the automotive industry. It addresses possible hazards due to malfunctions in electronic/electrical safety related systems in passenger vehicles up to 3500kg.
Isograph's world leading reliability software is used widely in the Automotive industry for ISO 26262 compliant safety analyses.

We appreciate your support of Isograph Software, if you have any questions or recommendations for the blog posts please let me know.
Best Regards, Jeremy
jhynek@isograph.com
Attack Tree Analysis Understanding and modelling threats
In today's increasingly interconnected world, system hazards are more likely than ever to originate from deliberate attacks, such as hacking and malware.
Using the example of how an attacker could gain access to on-board systems in a car by hacking into the entertainment system, this webinar will show how attack tree analysis, a modified form of fault tree analysis, can be used to predict the frequency of a threat due to attacks on a system and the failure of defensive measures.
We will also demonstrate how attack tree analysis can take into account the impact of a successful attack on factors such as cost and safety, as well as the cost and difficulty incurred by the attacker.
Included is a web demonstration where we will address modelling these threats in AttackTree+:
As always please feel free to contact me if you have any questions.
Best Regards, Jeremy
Building a fault tree from a schemtic
Included is our most popular webinar to date, where we will took the included schematic, of a propulsion system, and demonstrated the logic used to represent this schematic in a Fault Tree. Although there is more than one way to skin a cat, our Fault Tree expert created what he sees as the most logical model to represent this system.
For the ambitious I would suggest that you build your own model in FaultTree+ prior to viewing the meeting and see how your model matches up with ours. For those using demonstration versions of the software you can build the model and save the image using "Print Screen".
**HINT** in this example, the Fault Tree will look much simpler than the schematic. Watch for common cause failures.
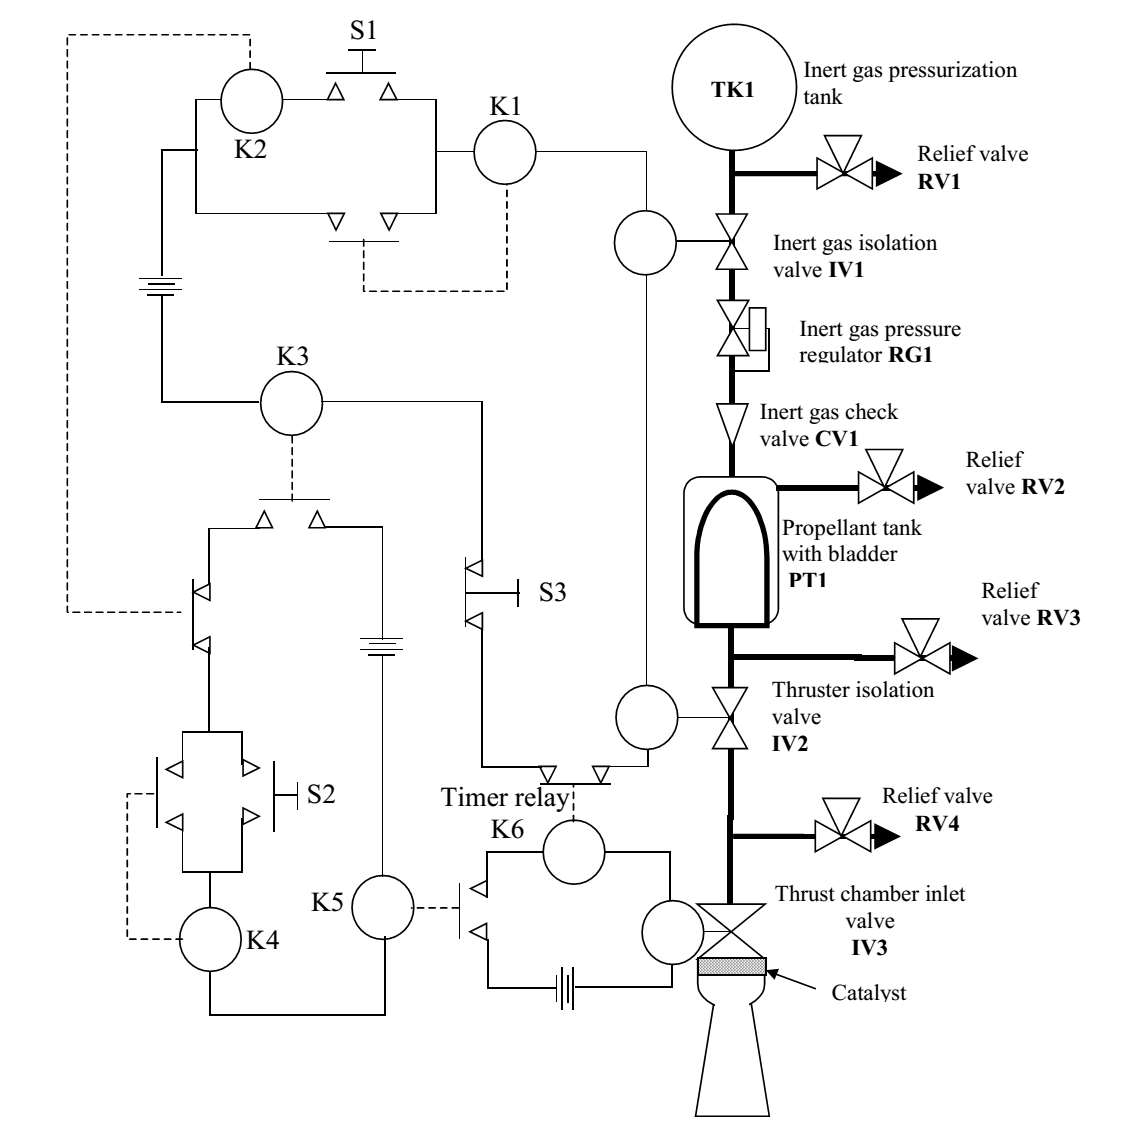
Please let me know if you have any questions about this Webinar, it will be well worth your time. As always this is not a sales focused web meeting it will be an educational webinar focused on the technical aspects of building a Fault Tree.
Best Regards, Jeremy
jhynek@isograph.com
Availability Workbench; RCMCost, AvSim, ERP portal
Although we post a lot of web demos that cover analytical topics related to the Reliability Workbench let's remember that the Availability Workbench is probably the most powerful tool of its kind on the market. There is a good chance someone you know is using the Availability Workbench!
Availability Workbench is used to optimise maintenance and spares policies, predict system availability and throughput and estimate life cycle costs. It includes well known modelling methods such as FMECA, Reliability Block Diagram Analysis and Fault Tree Analysis.
The following web demo is a high level overview of the software, if you have any questions or need more information on the software please let me know:
Reliability Workbench FaultTree+ general overview
Following feedback from users, it seems as though we can never post enough FaultTree+ web demonstrations. Included is general overview of our popular FaultTree+ software. In addition to an explanation on how the tool is used we have also added some useful information on import/export, search functions, customising the grid view, calculation options, approximation methods, Markov....ext.
As always if you have any questions on the web demonstration or need additional informaiton on our software products please feel free to contact me.
Best Regards,
Jeremy
jhynek@isograph.com
Weibull Analysis 101
For anyone that has spent a bit of time in reliability the term Weibull distribution has probably come up, or should have come up. It is named after Swedish mathematician Waloddi Weibull, who was the first to describe Weibull in length in 1951. Although Waloddi didn't actually come up with the math for Webiull, the formulas and even an application had been applied years before, he was the first to describe it and won the honour of having the Weibull distribution named after him.
Weibull Analysis is used to analyse historical failure data and produces failure distributions that we use during a system simulation.
The Weibull Analysis module of Availability Workbench analyses historical failure and repair data by assigning probability distributions which represent the failure or repair characteristics of a given failure mode.
The failure distribution assigned to a given set of times to failure (known as a Weibull set) may be assigned to locations in the RCMCost location hierarchy or failure models in the AvSim module.
The Weibull Analysis Module analyses times-to-failure and time-to-repair data using the following distributions:
Exponential Distribution
1-Parameter Weibull Distribution
2-Parameter Weibull Distribution
3-Parameter Weibull Distribution
Bi-Weibull
Tri-Weibull
Lognormal Distribution
Normal Distribution
Weibayes
Phased Bi-Weibull
Phased Tri-Weibull
I have included a recorded webinar giving a general Webull overview. We of course do not go into detail on the formulas used. If you would like additional information please contact me: jhynek@isograph.com
Best Kept Secret in Isograph’s software
Secret might be the wrong word to use here, it could be a matter of just asking myself or technical support the right questions. Even if you’ve been using Reliability Workbench, Availability Workbench, AttackTree+, or Network Availability Prediction for years, you’re probably still finding new features and tips and tricks to help you out in the software. Maybe one day you discovered a time-saver and thought to your self “what else can this software do to make my day easier?”
While there are plenty of helpful features in Isograph’s software to make your day easier, perhaps none is so powerful, incredibly useful, and so under-utilized as Plugins and the DLL. These features allow you to extend the power of Reliability Workbench, Availability Workbench, Attack Tree, and NAP tools to absurd heights. From creating macros for accomplishing tedious tasks, to automating fault tree construction, and even adding new features to the software that we haven’t even thought about, the Plugins and DLL can do it.
As always if you have any questions or need additional information on our products please feel free to contact me
Jeremy Hynek
Isograph, Inc.
jhynek@isograph.com
801 610 0045