Weird Things We’ve Modeled in AvSim
A while back, I was talking with David Wiseman from our UK office about one of the more unusual customer projects we’d seen: using Monte Carlo Simulation (AvSim) to track the availability of penguin trackers. That conversation turned into a much bigger discussion about all the strange, unexpected, and surprisingly creative things people have modeled in AvSim.
This got me thinking... I started wondering whether we could model the college football playoffs closely enough to predict actual game outcomes. At first, it sounded doable. Then we started listing everything we’d have to include:
- injuries
- player positions
- weather
- momentum swings
- fatigue
- coaching adjustments
- emotional factors
- live game updates
And somewhere in the middle of that conversation we both realized:
“Okay… this thing may never stop simulating.”
Oddly enough, it became a really good example of what AvSim is — and what it isn’t.
AvSim is incredibly powerful at modeling defined systems and reliability behavior. But trying to model a continuously evolving real-time system like a live football game introduces an entirely different level of complexity.
That discussion eventually became the inspiration for this webinar. But the webinar wasn’t really about penguins or us giving up on modeling the football playoffs. What we actually wanted to show was something much more useful: how engineers can think outside the box when modeling systems that don’t appear to fit neatly into the software.
One of the biggest lessons from years of reliability modeling was: Just because there isn’t a button for something doesn’t mean the software can’t do it.
Sometimes the best solutions come from understanding the logic of the system rather than looking for a specific feature.
Thinking Outside the Box
Just because there isn’t a built-in feature for something doesn’t mean it can’t be modeled. In this webinar David Wiseman demonstrates several examples where standard AvSim features can be combined in unconventional ways to create surprisingly advanced behaviors.
Our webinar focuses on four particularly interesting examples.
- Modeling Complex Maintenance Cycles
Most reliability engineers are familiar with simple recurring maintenance:
- every 6 months
- every year
- every 5 years
But what happens when the maintenance strategy changes throughout the life of the system?
The webinar demonstrated how offsets, repeated maintenance tasks, rules, and phases can be combined to model evolving maintenance schedules such as:
- PM1 during years 1–3
- PM2 during year 4
- PM1 again during years 5–7
- PM3 later in the lifecycle
Instead of forcing the software into a rigid maintenance pattern, the model used cleverly staggered intervals and rules to create dynamic maintenance behavior over time.
The result:
A highly flexible maintenance strategy without requiring any new software functionality.
- Changing Capacity Targets Without a Rule
One particularly interesting challenge involved changing a system’s production target depending on the phase of the system lifecycle.
The issue?
AvSim does not include a direct rule for changing capacity targets dynamically.
To achieve this capability, the webinar demonstrated a creative use of logic:
multiple output nodes with different capacity targets were selectively enabled or disabled using logic-state dummy blocks and phase rules.
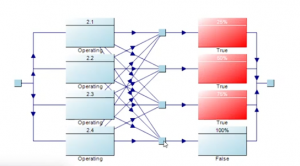
In practice, this allowed the model to simulate:
- lower production targets during early years
- increasing demand during peak years
- ramp-down behavior later in life
It was a perfect example of modeling creativity:
using existing logic features in unexpected ways to achieve the desired system behavior.
- Using Buffers as a “Clock”
Perhaps the most technically creative example involved ramp times.
The challenge:
How do you increase ramp-up time depending on how long the original outage lasted?
For example:
- outages under 8 hours → 1.5-hour ramp time
- outages between 8–48 hours → 3-hour ramp time
- outages over 48 hours → 6-hour ramp time
Since AvSim does not directly support conditional ramp times, the solution used buffers as timing mechanisms.
As outages progressed:
- buffers slowly emptied
- empty buffers triggered additional logic states
- additional failures introduced longer repair delays
In effect, the buffers acted like internal clocks measuring outage duration. The result was a sophisticated dynamic ramp-time model built entirely from existing software features.
It was also one of the clearest demonstrations of how system modeling often becomes a form of engineering problem-solving creativity.
- Modeling Network Loops with RBDs
The final example explored how Reliability Block Diagrams (RBDs) can model network-style systems with multiple routing paths.
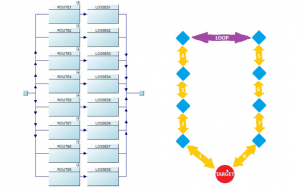
One key lesson stood out:
An RBD is not a physical drawing of the system.
It is a representation of reliability logic.
This distinction becomes extremely important when modeling looped systems such as:
- power grids
- communication networks
- water distribution systems
- process routing networks
Instead of drawing the physical architecture directly, the model represented all possible logical paths product could take through the network. The webinar shows how adding a loop dramatically improved redundancy and reduced lost production costs.
In one comparison:
- the non-looped design resulted in roughly $12 million in losses
- the looped design reduced losses to roughly $200,000
A powerful reminder that small architectural changes can produce massive reliability improvements.
The Bigger Lesson
Although the webinar covered several highly specific examples, the underlying message applied broadly to reliability engineering:
The best models often come from understanding system logic, not simply following default software workflows.
Many advanced behaviors become possible when engineers:
- combine features creatively
- think in terms of system logic
- separate physical architecture from modeling the logical behavior
- test assumptions visually using simulation tools
As David Wiseman explains during the webinar, AvSim cannot possibly include a dedicated feature for every imaginable system behavior. But with the right modeling approach, engineers can often achieve the behavior they need anyway.
Final Thoughts
The webinar was a reminder that RAMS engineering is part mathematics, part systems thinking, and occasionally… part creativity experiment.
Whether modeling:
- maintenance evolution
- changing production targets
- dynamic ramp times
- looped networks
- or even hypothetical football simulations
…the same principle applies:
When you understand the logic of the system first. The software is often capable of far more than it initially appears.
If you missed the webinar or would like help solving a challenging modeling problem, the Isograph (PeakAvenue) teams are always happy to discuss unusual systems, advanced logic strategies, and creative approaches to RAM analysis. Please feel free to contact me:
Best Regards,
Jeremy Hynek
VP Business Development
Isograph Inc. | a PeakAvenue Company
375 S Main St, Alpine, UT 84004
Phone: 801 610 0049 | Mobile: 949 813 1284