Customizing Availability Workbench (AWB) Reports

One of the most important aspects of your reliability or safety studies is the creation of professional standard reports that will enable you to present the results in a clear and understandable form to colleagues, management, customers and regulatory bodies.

How can I use the Report Designer?

The Isograph reliability software products share a common facility to produce reports containing text, graphs or diagrams. Your input data and output results from reliability applications are stored in a database. This information can be examined, filtered, sorted and displayed by the Report Designer. The Report Designer allows you to use reports supplied by Isograph to print or print preview the data. A set of report formats appropriate to the product is supplied with each product.

You can also design your own reports, either from an empty report page or by copying one of the supplied reports and using that as the starting point. Reports may be published or exported to PDF and Word formats.

How do I make a Text Report?

Designing a text report is simplicity itself. The steps required are as follows: Select the paper size and margins. Select a subset of the whole project database information to be included in the report by one of two options.

The first option contains a list of pre-defined selection criteria corresponding to one or more tables in the database. Each criteria will result in a list of available fields. The alternative method is based on using SQL commands to query the database. Each field selected will be represented by a column in the report. Specify which fields are required in the report and the ordering of the columns in which the information will appear. At this point, the user may select print preview and a basic report will be displayed. The design process may continue in print preview mode if required. as page numbers, the current date, sums of field values may be displayed in the header and footer areas using the text boxes combined with report macros. Pictures in all the common formats (gif, jpg, bmp etc) may also be displayed in the footer or header.

Graph reports can contain one or more graph pages each of which in turn can contain one or more graphs. The graphs themselves can display one or more plots. Each graph has axes, labels, legends and titles that are configured using simple dialogs. Some of the main features are described below : 3-dimensional graph type have the added facility of setting the viewing angle by moving slider controls that alter the rotation and elevation angles. Easily select and filter the data to be plotted.

Use the standard report types that are supplied with the software or design your own graph reports by either modifying existing reports or creating completely new ones. The size and position of the graph area within a report page can be set either through a dialog or more intuitively by the use of the mouse. A graph contains a rich array of attributes each of which can be easily set through the use of a tabbed dialog. Plot data as 2-D line, bar, pie, area and scatter graphs or 3-D bar, pie, scatter and tape graphs. Plot log/lin, log/log or lin/log graphs. These graphs can be plotted in various vertical or horizontal styles.

Print them out directly to color or monochrome devices or export them in Rich Text Format (RTF). The RTF file can then be imported into other products such as Microsoft Word where it could be combined into a larger document and then printed. If required additional data such as page numbers, the current date, sums of field values may be displayed in the header and footer areas using the text boxes combined with report macros. Pictures in all the common formats (gif, jpg, bmp etc) may also be displayed in the footer or header.

Generating Diagram Reports in Report Designer Many of the Isograph software products use diagrams to represent the system logic. Examples are reliability networks and fault trees. Using the report generator it is possible to include these diagrams in a report. A diagram report may consist of one or more pages, for example, a fault tree diagram may be spread across many pages. Some of the main features are described below: The vertical and horizontal indents in the drawing area may be specified Whether the diagram should maintain its aspect ratio or fit to the drawing area may be specified when used in conjunction with programs such as Reliability Workbench which contain multiple software modules the category of diagram to be displayed may be selected.

As with graph and text reports, diagram reports can be either printed out directly to color or monochrome devices or exported in Rich Text Format (RTF). The RTF file can then be imported into other products such as Microsoft Word where it could be combined into a larger document and then printed.

Tech Tuesday: Reliability Workbench 12

Howdy, folks! Isograph has recently launched Reliability Workbench 12, the latest incarnation of our flagship reliability analysis product. There are a number of new features and improvements, and today I'll be talking about a couple big changes.

The first and biggest change is the addition of a new Safety Assessment module. This new module allows users to perform Functional Hazard Analysis, PSSA analysis, and other safety assessments in accordance with SAE ARP 4761 and other similar standards.

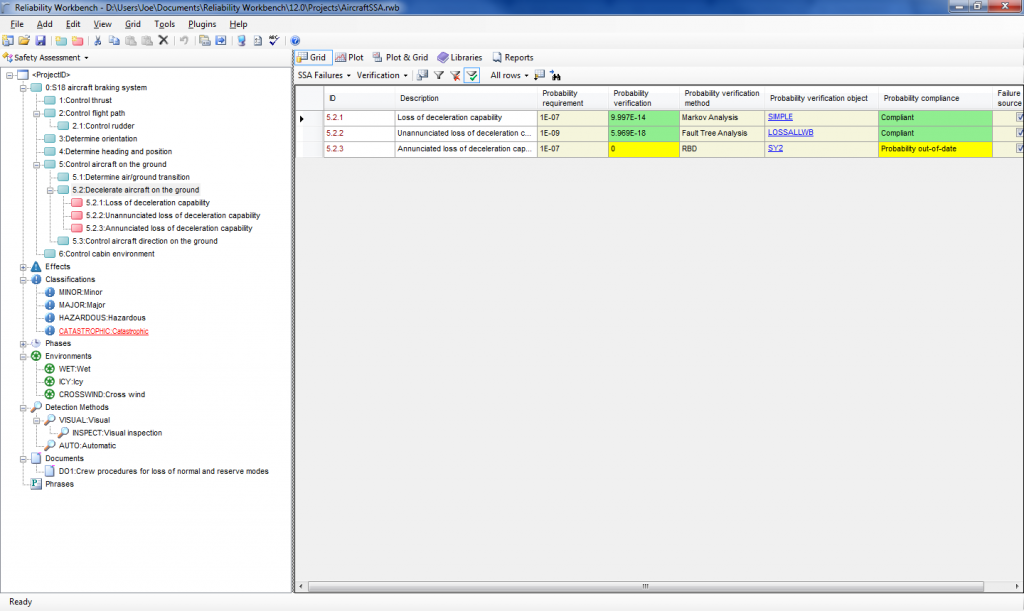
The System Safety Assessment (SSA) module allows users to construct a functional failure mode hierarchy, similar to the FMECA module of Reliability Workbench, or the RCMCost module of Availability Workbench. This functional hierarchy will list the functional requirements of the system, and the functional failures that could inhibit the system's ability to perform the functional requirements. So for instance, an aircraft braking system could have several functional requirements, such as control thrust, control aircraft on the ground, and decelerate aircraft on the ground. The "decelerate aircraft on the ground" function could fail if there is a loss of deceleration capability.

An example failure mode hierarchy.

Each failure can produce an effect. In our aircraft braking example, effects of failure of the braking system could be runway overrun, in which the aircraft is not able to completely decelerate the aircraft before the end of the runway. Then, each effect can have a user-defined classification, such as minor, major, or catastrophic. You can further define phases and conditions and tell the program that the effect only occurs during a particular phase or phases, and under specified conditions. For instance, the effect of a failure mode on an aircraft may only occur during take-off and landing, or in icy or wet conditions.

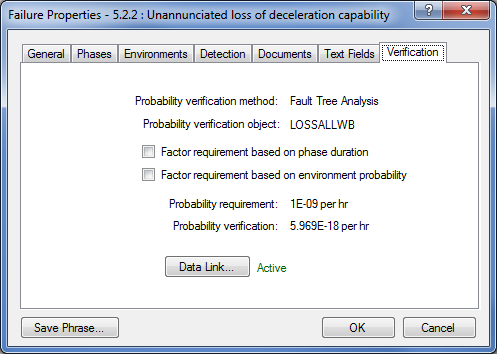
So far, so good. This isn't too different from what many users already use FMECA or RCMCost for. But what differentiates the SSA module is its ability to link to analyses in other modules, to provide justification that any safety or reliability targets have been met. Each effect classification in the SSA can have an assigned probability requirement associated with it. Then each failure mode can be linked to another analysis, either a Fault Tree, RBD, FMECA, Markov, or Prediction. The SSA module will then compare the probability requirement of the effect classification with the calculated probability from the other analysis to determine if the probability requirement is being met.

SSA verification

For example, in our aircraft overrun scenario, this effect is assigned a classification of catastrophic. The Powers That Be have decreed that catastrophic failure modes should not have a probability of greater than 1E-9 per hour. We can enter this information into the SSA module. Next, we can link the loss of deceleration capability failure mode to another analysis, perhaps a Fault Tree analysis, that calculates the probability of the failure mode's occurrence. The SSA module will then tell us if we're meeting our reliability target for the failure mode, based on the reliability analysis we've done.

While users have been building Fault Trees, RBDs, Markov models to verify a reliability target for years, the power of the System Safety Assessment module is that it can link all these analyses into a functional failure mode hierarchy. Previously, a user might have one Fault Tree to examine one critical system, then a Markov model to analyze another, with no organization or relation between the two. The power of the SSA module is that it allows users to combine all their reliability analyses into a single master project, showing all the failure modes of the system, and providing documented verification that reliability targets are being met. You can then print out reports showing the reliability targets and the reliability verified via quantitative analysis.

SSA Verification 2

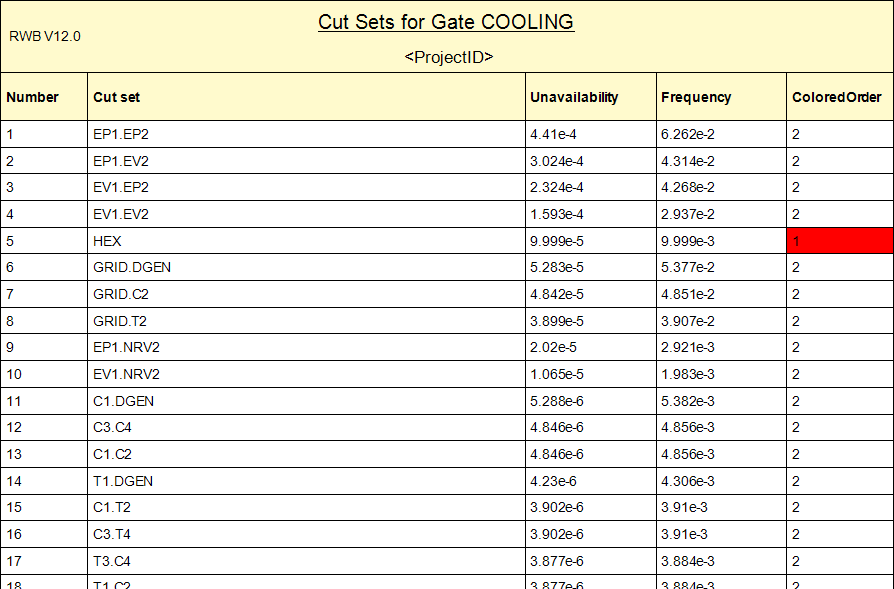
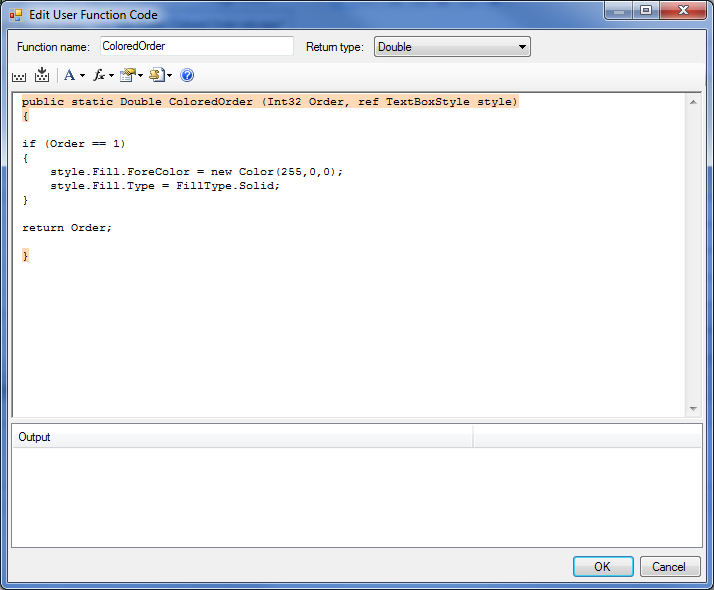
The other major new feature I want to talk about is User Columns in reports. User columns allow you to take the outputs from a report, then write simple code, either in Visual Basic or C# style, to create a new column in the report. Mostly, this is used to create conditional formatting, such that the font color, size, or style of a field in the report can be changed based on the value of that field, or of another field in the same row. But it can also be used to create more advanced columns, such as mathematical expressions, or logical conditions, that change the data displayed in a column. This could be used to change the units of a column, or combine multiple columns into one to, for instance, show either failure rate or characteristic life in a column, depending on whether the Rate or Weibull failure model is used.

Conditional formatting
An example of conditional formatting using User Columns that highlights first-order cut sets in red.
Conditional formatting code
The code used to generate the conditional formatting.

There are numerous other modifications and improvements that have been made in the latest release. You can read a summary of all the changes here. Customers with a current maintenance contract can upgrade for free, although you should contact us for a new license. Others can download a trial version to test it out. If you're interested in more information, or would like to upgrade, please give us a call or send us an email.

Let's Keep In Touch!

Subscribe to our newsletter to get the latest information on Isograph software.


By submitting this form, you are consenting to receive marketing emails from: . You can revoke your consent to receive emails at any time by using the SafeUnsubscribe® link, found at the bottom of every email. Emails are serviced by Constant Contact