Howdy, folks! Isograph has recently launched Reliability Workbench 12, the latest incarnation of our flagship reliability analysis product. There are a number of new features and improvements, and today I'll be talking about a couple big changes.
The first and biggest change is the addition of a new Safety Assessment module. This new module allows users to perform Functional Hazard Analysis, PSSA analysis, and other safety assessments in accordance with SAE ARP 4761 and other similar standards.
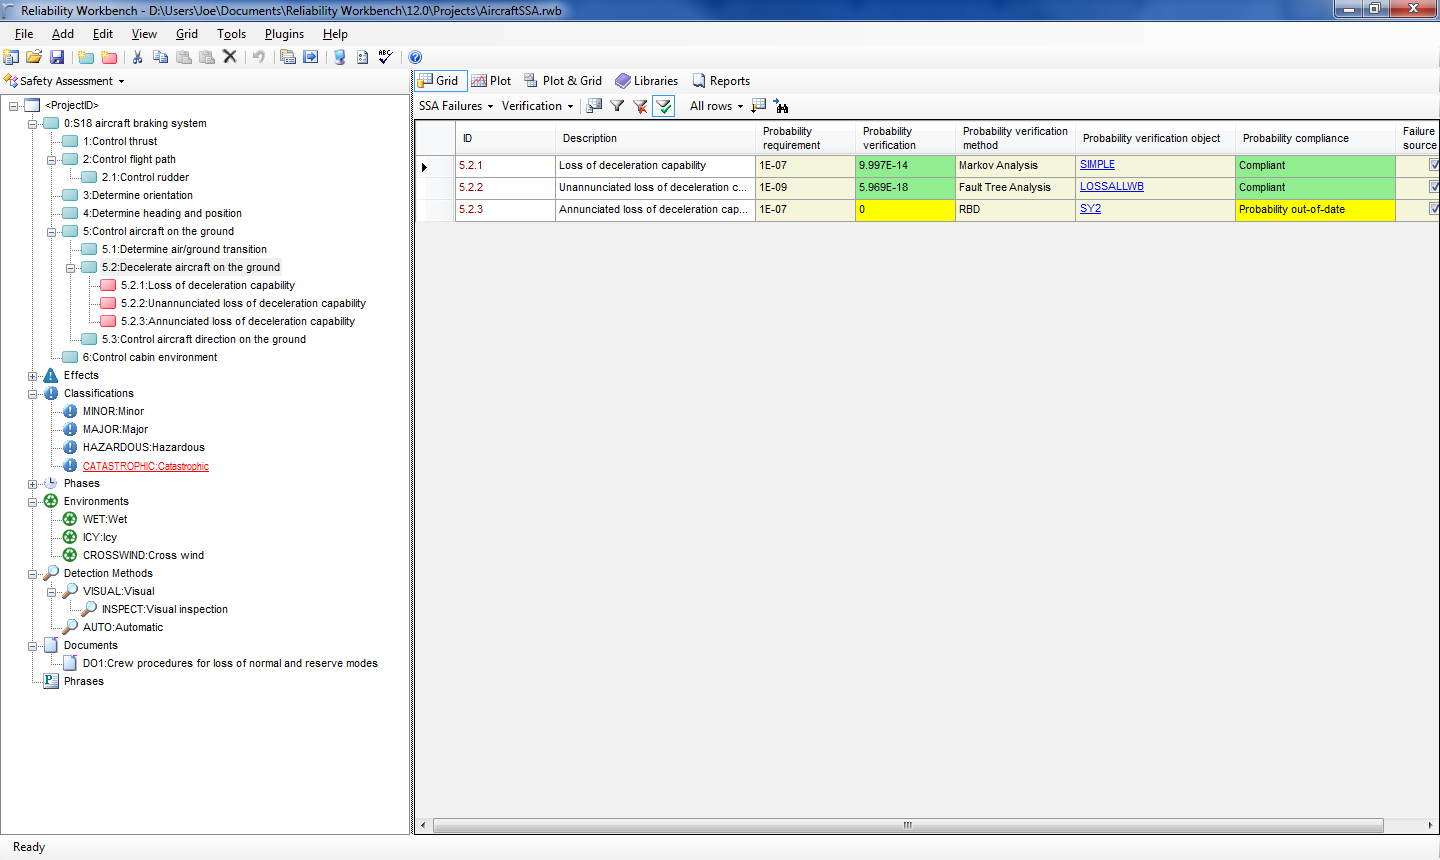
The System Safety Assessment (SSA) module allows users to construct a functional failure mode hierarchy, similar to the FMECA module of Reliability Workbench, or the RCMCost module of Availability Workbench. This functional hierarchy will list the functional requirements of the system, and the functional failures that could inhibit the system's ability to perform the functional requirements. So for instance, an aircraft braking system could have several functional requirements, such as control thrust, control aircraft on the ground, and decelerate aircraft on the ground. The "decelerate aircraft on the ground" function could fail if there is a loss of deceleration capability.

Each failure can produce an effect. In our aircraft braking example, effects of failure of the braking system could be runway overrun, in which the aircraft is not able to completely decelerate the aircraft before the end of the runway. Then, each effect can have a user-defined classification, such as minor, major, or catastrophic. You can further define phases and conditions and tell the program that the effect only occurs during a particular phase or phases, and under specified conditions. For instance, the effect of a failure mode on an aircraft may only occur during take-off and landing, or in icy or wet conditions.
So far, so good. This isn't too different from what many users already use FMECA or RCMCost for. But what differentiates the SSA module is its ability to link to analyses in other modules, to provide justification that any safety or reliability targets have been met. Each effect classification in the SSA can have an assigned probability requirement associated with it. Then each failure mode can be linked to another analysis, either a Fault Tree, RBD, FMECA, Markov, or Prediction. The SSA module will then compare the probability requirement of the effect classification with the calculated probability from the other analysis to determine if the probability requirement is being met.
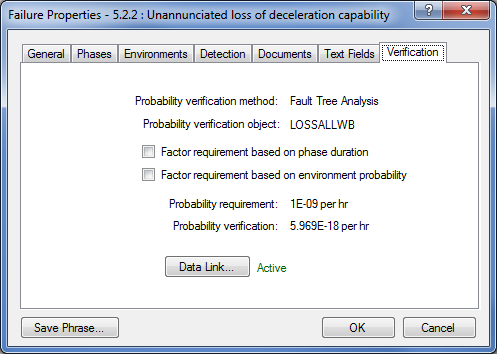
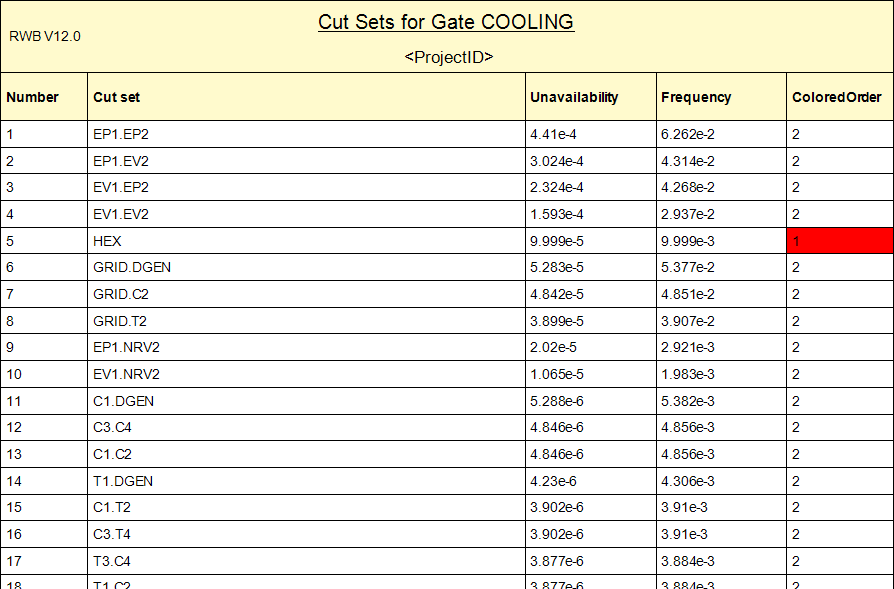
For example, in our aircraft overrun scenario, this effect is assigned a classification of catastrophic. The Powers That Be have decreed that catastrophic failure modes should not have a probability of greater than 1E-9 per hour. We can enter this information into the SSA module. Next, we can link the loss of deceleration capability failure mode to another analysis, perhaps a Fault Tree analysis, that calculates the probability of the failure mode's occurrence. The SSA module will then tell us if we're meeting our reliability target for the failure mode, based on the reliability analysis we've done.
While users have been building Fault Trees, RBDs, Markov models to verify a reliability target for years, the power of the System Safety Assessment module is that it can link all these analyses into a functional failure mode hierarchy. Previously, a user might have one Fault Tree to examine one critical system, then a Markov model to analyze another, with no organization or relation between the two. The power of the SSA module is that it allows users to combine all their reliability analyses into a single master project, showing all the failure modes of the system, and providing documented verification that reliability targets are being met. You can then print out reports showing the reliability targets and the reliability verified via quantitative analysis.
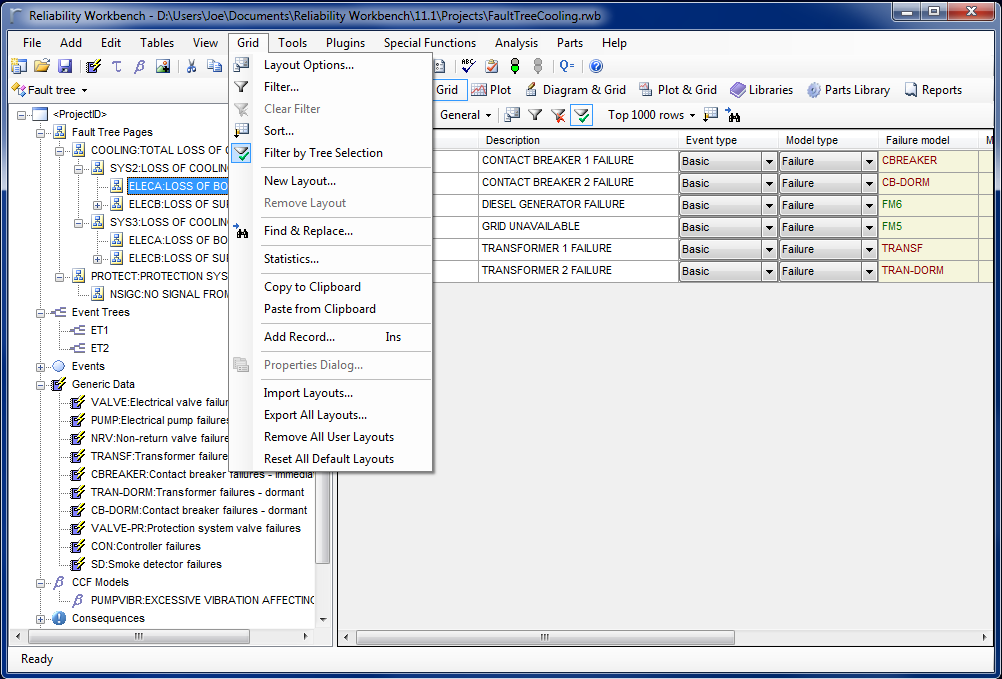
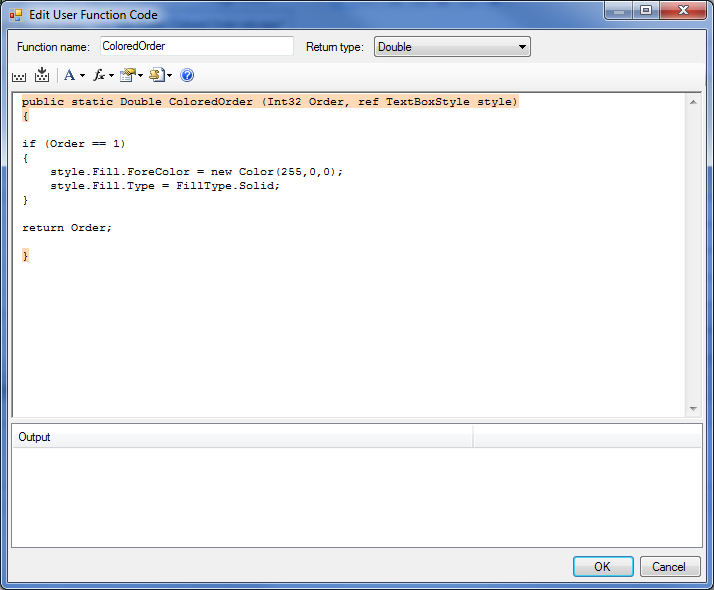
The other major new feature I want to talk about is User Columns in reports. User columns allow you to take the outputs from a report, then write simple code, either in Visual Basic or C# style, to create a new column in the report. Mostly, this is used to create conditional formatting, such that the font color, size, or style of a field in the report can be changed based on the value of that field, or of another field in the same row. But it can also be used to create more advanced columns, such as mathematical expressions, or logical conditions, that change the data displayed in a column. This could be used to change the units of a column, or combine multiple columns into one to, for instance, show either failure rate or characteristic life in a column, depending on whether the Rate or Weibull failure model is used.
There are numerous other modifications and improvements that have been made in the latest release. You can read a summary of all the changes here. Customers with a current maintenance contract can upgrade for free, although you should contact us for a new license. Others can download a trial version to test it out. If you're interested in more information, or would like to upgrade, please give us a call or send us an email.