Customizing Availability Workbench (AWB) Reports

One of the most important aspects of your reliability or safety studies is the creation of professional standard reports that will enable you to present the results in a clear and understandable form to colleagues, management, customers and regulatory bodies.

How can I use the Report Designer?

The Isograph reliability software products share a common facility to produce reports containing text, graphs or diagrams. Your input data and output results from reliability applications are stored in a database. This information can be examined, filtered, sorted and displayed by the Report Designer. The Report Designer allows you to use reports supplied by Isograph to print or print preview the data. A set of report formats appropriate to the product is supplied with each product.

You can also design your own reports, either from an empty report page or by copying one of the supplied reports and using that as the starting point. Reports may be published or exported to PDF and Word formats.

How do I make a Text Report?

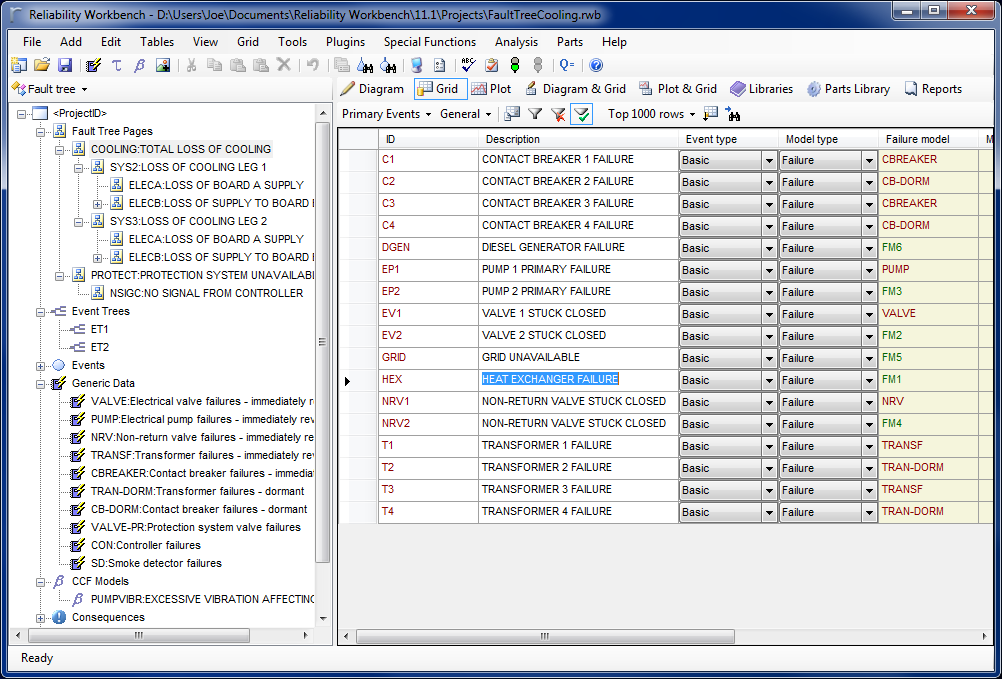
Designing a text report is simplicity itself. The steps required are as follows: Select the paper size and margins. Select a subset of the whole project database information to be included in the report by one of two options.

The first option contains a list of pre-defined selection criteria corresponding to one or more tables in the database. Each criteria will result in a list of available fields. The alternative method is based on using SQL commands to query the database. Each field selected will be represented by a column in the report. Specify which fields are required in the report and the ordering of the columns in which the information will appear. At this point, the user may select print preview and a basic report will be displayed. The design process may continue in print preview mode if required. as page numbers, the current date, sums of field values may be displayed in the header and footer areas using the text boxes combined with report macros. Pictures in all the common formats (gif, jpg, bmp etc) may also be displayed in the footer or header.

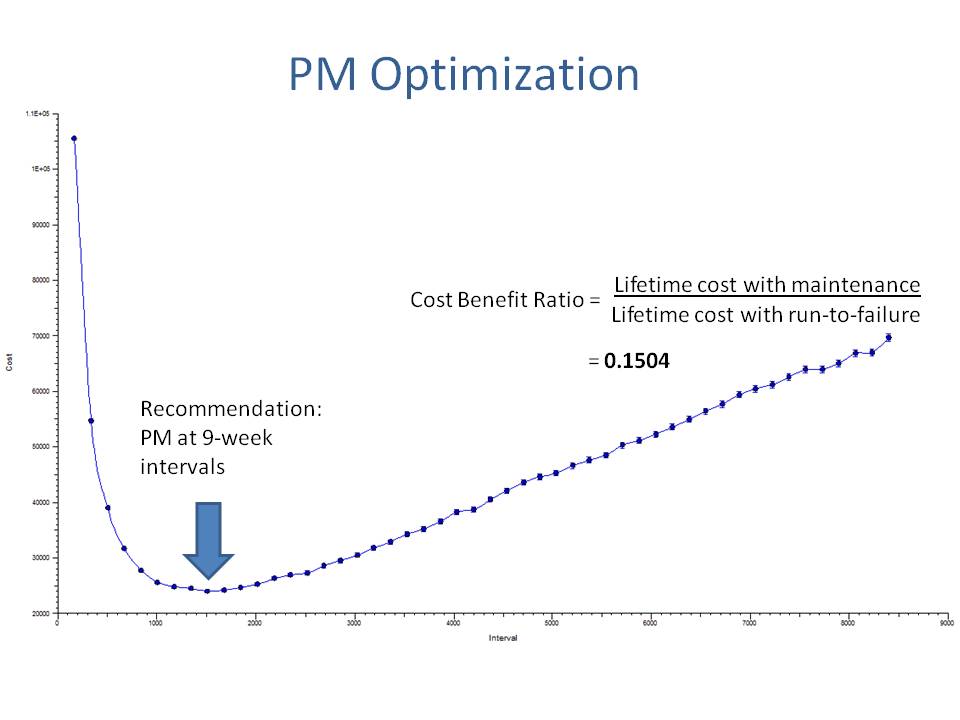
Graph reports can contain one or more graph pages each of which in turn can contain one or more graphs. The graphs themselves can display one or more plots. Each graph has axes, labels, legends and titles that are configured using simple dialogs. Some of the main features are described below : 3-dimensional graph type have the added facility of setting the viewing angle by moving slider controls that alter the rotation and elevation angles. Easily select and filter the data to be plotted.

Use the standard report types that are supplied with the software or design your own graph reports by either modifying existing reports or creating completely new ones. The size and position of the graph area within a report page can be set either through a dialog or more intuitively by the use of the mouse. A graph contains a rich array of attributes each of which can be easily set through the use of a tabbed dialog. Plot data as 2-D line, bar, pie, area and scatter graphs or 3-D bar, pie, scatter and tape graphs. Plot log/lin, log/log or lin/log graphs. These graphs can be plotted in various vertical or horizontal styles.

Print them out directly to color or monochrome devices or export them in Rich Text Format (RTF). The RTF file can then be imported into other products such as Microsoft Word where it could be combined into a larger document and then printed. If required additional data such as page numbers, the current date, sums of field values may be displayed in the header and footer areas using the text boxes combined with report macros. Pictures in all the common formats (gif, jpg, bmp etc) may also be displayed in the footer or header.

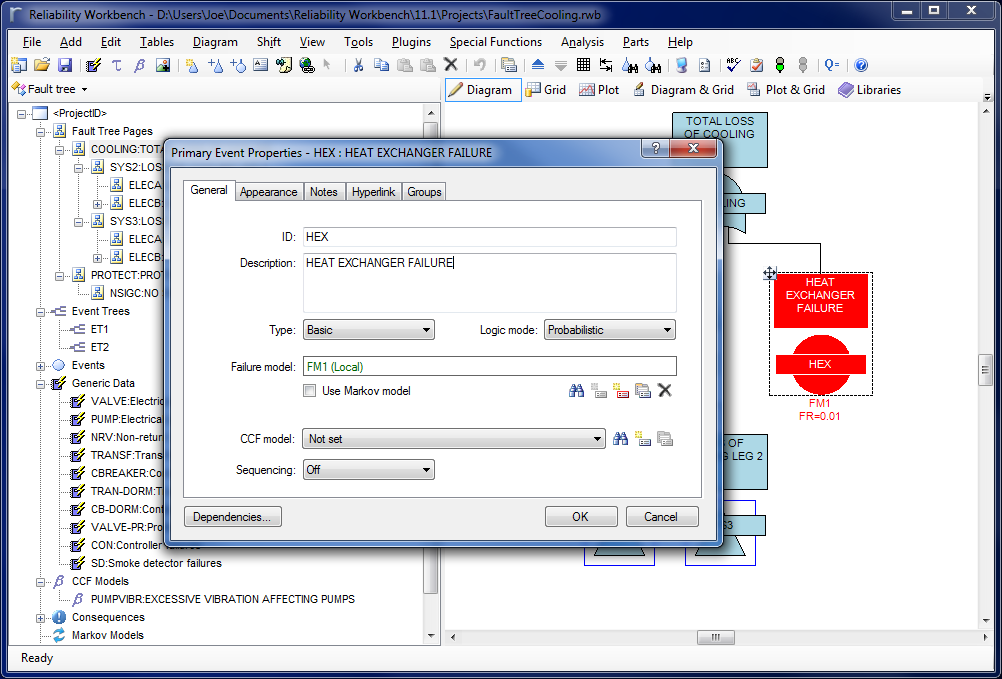
Generating Diagram Reports in Report Designer Many of the Isograph software products use diagrams to represent the system logic. Examples are reliability networks and fault trees. Using the report generator it is possible to include these diagrams in a report. A diagram report may consist of one or more pages, for example, a fault tree diagram may be spread across many pages. Some of the main features are described below: The vertical and horizontal indents in the drawing area may be specified Whether the diagram should maintain its aspect ratio or fit to the drawing area may be specified when used in conjunction with programs such as Reliability Workbench which contain multiple software modules the category of diagram to be displayed may be selected.

As with graph and text reports, diagram reports can be either printed out directly to color or monochrome devices or exported in Rich Text Format (RTF). The RTF file can then be imported into other products such as Microsoft Word where it could be combined into a larger document and then printed.

RCMCost – Intro – Part of Availability Workbench Suite

Reliability Centered Maintenance Software

* Predict asset performance
* Optimize your maintenance strategy
* Reduce operational risks
* Improve profitability
* Increase uptime and lower costs
* Optimize spares holdings
* Simulate predictive maintenance
* Meet safety, environmental and operational targets
* Supports standards such as SAE JA1011, MSG-3 and
* MIL-STD-2173(AS)

Reliability 2.0….. cliff notes

This years Reliability 2.0 meeting in Las Vegas was a great meeting with a bit of bowling, gambling and interesting discussions on topics like Monte Carlo Simulation. (Which seems like a fitting topic for Las Vegas.)  Reliability 2.0 2014 included 2 papers authored and co-authored by Isograph employees. Dr. Gabriel Lima's (Isograph Partner) paper titled "Practical Models for Decision-Making in Asset Management" . As an economics professor Gabriel was able to give a unique point of view regarding what motivates asset management strategies. Factors such as increased reliability, improve availability, reduced unit cost, reduced risk and improved frequency of failure .  Below is a photo from Gabriel 3 hour training course. If you are interested in the course notes please contact me jhynek@isograph.com .

Reliability20Gabriel

Dr. David Wiseman a die hard Liverpool soccer fan, nuclear physicist  and employee of Isograph also presented a paper titled "Monte Carlo Simulation as an Aid to PM Optimization" .  In this paper David clears up the common misconception that massive amounts of data are needed to perform a simulation to optimize your PM intervals.  For a basic simulation all that is needed is the Mean Time To Repair (MTTR), the price of the PM interval and less than a weeks worth of test data. Using this data a recommended PM interval and Cost Benefit Ratio are easily calculated.

Presentation1

We all walked away from the conference with minor gambling losses and a better idea on how to approach our asset management models. For additional information please contact Isograph: 949 502 5919 jhynek@isograph.com , www.isograph.com

Tech Tuesday: The Grid Control

Howdy, folks. This will be the first installment of what we hope will become a regular feature around here. Each Tuesday, look for an article highlighting a technical aspect of our software. This may be a demonstration of a feature, an explanation of the mathematics that power the tools, or some comments on technical support questions that we're frequently asked.

Today, I'll be talking about the Grid Control feature of our Availability Workbench and Reliability Workbench tools. If you've used our AvSim or FaultTree+ software, you know the power of the tool, and the usefulness of the diagram view to be able to create and edit intricate Fault Tree or Reliability Block Diagrams (RBDs). However, sometimes you may find that you have to do some task, such as text entry, or finding and replacing some information, that can be cumbersome to perform in the diagram view.

For instance, suppose you've created a large, multi-page Fault Tree, and now you want to add unique IDs and descriptions to all the gates and events, so you can identify what each one represents. To do this in the diagram view, you'd need to locate each item individually, double-click to open the Properties dialog for the gate or event, set the ID and description, click "OK" to close the dialog, find the next item, rinse, and repeat. There's a lot of back-and-forth between mouse and keyboard, and hunting through the diagram for the items you want.

Properties
The Event Properties dialog from FaultTree+

The Grid control helps with this by providing a tabular format for editing data, similar to what you'd see in Microsoft's Excel or Access products. Each gate or event appears on one line of the grid, and you can use the cursor keys, or the tab key, to navigate the records and fields. To edit some text, simply highlight a field with the mouse or keyboard and start typing, or press Enter on your keyboard.

Grid
The Grid view in FaultTree+

From the grid view, you can use the table selector to choose which data you want to display. This might be the Gates, Events, or Failure Models table in FaultTree+ , or the RBD Blocks or Failure Models table in AvSim.

TableSelector
Grid Table selector

With a given table selected, you can refine which records should be displayed by using the "Filter Grid by Tree Control Selection" option, found in the Grid menu. This mouthful-of-a-name simply means that data will only be displayed in the Grid if it's relevant to the selection in the tree control on the left hand side. For instance, selecting a particular gate in the Fault Tree hierarchy will only show events under that gate, or selecting a Failure Model group in the AvSim project will only display failure models in that group.

FilterByTreeControlSelection
"Filter by Tree Selection" turned on; note how only events logically dependent on the selection on the left are displayed in the grid.

There are plenty more options in the Grid view that allow you to choose what data is displayed. You can use the Grid Layout options to choose what columns should be displayed, and what their order should be; the Grid Filter provides further methods of filtering records; and the Grid Sort allows you to choose how the records are sorted. And any custom grid layout, filtering, or sorting you've created can be saved, so you can share it with your colleagues or transfer it to a new computer. You can even copy and paste data directly from the Grid view to a spreadsheet application like Microsoft Excel.

GridOptions
The options under the Grid menu. Layout Options, Filter, and Sort are all near the top. Options to import and export grid layouts are near the bottom.

There's even a Find & Replace feature, for when you need it. The cool part is, when you use Find & Replace, it will only apply to the currently-displayed records. If you use a filter to hide certain rows, they won't be included in the replacement.

FindandReplace
The Find & Replace dialog. This works exactly like you'd expect.

And for those times when you want the Properties dialog, you can just double-click the grey space to the left of a grid row to open the Properties dialog for the item.

Why don't you take a look at the Grid control, and try it out? I've found it to be a great tool to use when quickly building or editing a project.

Let's Keep In Touch!

Subscribe to our newsletter to get the latest information on Isograph software.


By submitting this form, you are consenting to receive marketing emails from: . You can revoke your consent to receive emails at any time by using the SafeUnsubscribe® link, found at the bottom of every email. Emails are serviced by Constant Contact