Common Mistakes in Reliability-Centered Maintenance

Title: Common Mistakes in Reliability-Centered Maintenance

Reliability-Centered Maintenance (RCM) is a systematic approach to managing the maintenance of assets to ensure their optimal performance, safety, and longevity. However, even with the best intentions, organizations can make common mistakes in their RCM processes that undermine its effectiveness. Three of these mistakes are over-focusing on singular strategies, a lack of training and documentation, and improper data collection.

One prevalent mistake in RCM implementation is an overemphasis on singular strategies, often exemplified by an undue fixation on developing preventive maintenance (PM) schedules. While preventive maintenance is a vital aspect of RCM, concentrating all efforts solely on this aspect can lead to a myopic approach. RCM is a comprehensive methodology that encompasses various strategies, such as predictive maintenance, condition-based monitoring, and run-to-failure, in addition to preventive maintenance. An exclusive focus on PM can lead to inefficiencies, unnecessary costs, and missed opportunities to optimize asset performance. To avoid this mistake, organizations should strive for a balanced approach, considering all suitable maintenance strategies based on asset criticality and operational context.

Another common error in RCM is the neglect of training and documentation. Effective RCM implementation requires a well-trained team with a deep understanding of the methodology. Inadequate training can result in misinterpretations of asset criticality, inappropriate maintenance strategies, and inconsistent decision-making. Furthermore, documentation is essential to maintain a clear record of RCM analyses, decisions, and actions. A lack of documentation can hinder knowledge transfer, making it challenging to sustain RCM practices over time. Organizations should invest in comprehensive training programs for their personnel involved in RCM and ensure that documentation is meticulous and accessible.

Improper data collection represents a critical pitfall in the RCM process. RCM relies heavily on accurate data to make informed decisions regarding asset maintenance. Inaccurate or incomplete data can lead to incorrect assessments of asset criticality and performance, resulting in inappropriate maintenance strategies. Organizations often fall into the trap of relying on outdated or unreliable data sources, undermining the effectiveness of their RCM efforts. To rectify this mistake, organizations should establish robust data collection and management processes, regularly review and update data sources, and invest in advanced technologies like sensors and data analytics to enhance data accuracy.

In conclusion, while Reliability-Centered Maintenance offers numerous benefits in terms of asset reliability and cost-effectiveness, organizations can make common mistakes that hinder its successful implementation. These mistakes include an over-focus on singular strategies, neglecting training and documentation, and improper data collection. Recognizing and addressing these mistakes is essential for organizations seeking to derive the maximum value from their RCM initiatives. A holistic and balanced approach, coupled with adequate training, comprehensive documentation, and accurate data collection, can lead to more successful RCM implementations and improved asset performance.
Customizing Availability Workbench (AWB) Reports

One of the most important aspects of your reliability or safety studies is the creation of professional standard reports that will enable you to present the results in a clear and understandable form to colleagues, management, customers and regulatory bodies.

How can I use the Report Designer?

The Isograph reliability software products share a common facility to produce reports containing text, graphs or diagrams. Your input data and output results from reliability applications are stored in a database. This information can be examined, filtered, sorted and displayed by the Report Designer. The Report Designer allows you to use reports supplied by Isograph to print or print preview the data. A set of report formats appropriate to the product is supplied with each product.

You can also design your own reports, either from an empty report page or by copying one of the supplied reports and using that as the starting point. Reports may be published or exported to PDF and Word formats.

How do I make a Text Report?

Designing a text report is simplicity itself. The steps required are as follows: Select the paper size and margins. Select a subset of the whole project database information to be included in the report by one of two options.

The first option contains a list of pre-defined selection criteria corresponding to one or more tables in the database. Each criteria will result in a list of available fields. The alternative method is based on using SQL commands to query the database. Each field selected will be represented by a column in the report. Specify which fields are required in the report and the ordering of the columns in which the information will appear. At this point, the user may select print preview and a basic report will be displayed. The design process may continue in print preview mode if required. as page numbers, the current date, sums of field values may be displayed in the header and footer areas using the text boxes combined with report macros. Pictures in all the common formats (gif, jpg, bmp etc) may also be displayed in the footer or header.

Graph reports can contain one or more graph pages each of which in turn can contain one or more graphs. The graphs themselves can display one or more plots. Each graph has axes, labels, legends and titles that are configured using simple dialogs. Some of the main features are described below : 3-dimensional graph type have the added facility of setting the viewing angle by moving slider controls that alter the rotation and elevation angles. Easily select and filter the data to be plotted.

Use the standard report types that are supplied with the software or design your own graph reports by either modifying existing reports or creating completely new ones. The size and position of the graph area within a report page can be set either through a dialog or more intuitively by the use of the mouse. A graph contains a rich array of attributes each of which can be easily set through the use of a tabbed dialog. Plot data as 2-D line, bar, pie, area and scatter graphs or 3-D bar, pie, scatter and tape graphs. Plot log/lin, log/log or lin/log graphs. These graphs can be plotted in various vertical or horizontal styles.

Print them out directly to color or monochrome devices or export them in Rich Text Format (RTF). The RTF file can then be imported into other products such as Microsoft Word where it could be combined into a larger document and then printed. If required additional data such as page numbers, the current date, sums of field values may be displayed in the header and footer areas using the text boxes combined with report macros. Pictures in all the common formats (gif, jpg, bmp etc) may also be displayed in the footer or header.

Generating Diagram Reports in Report Designer Many of the Isograph software products use diagrams to represent the system logic. Examples are reliability networks and fault trees. Using the report generator it is possible to include these diagrams in a report. A diagram report may consist of one or more pages, for example, a fault tree diagram may be spread across many pages. Some of the main features are described below: The vertical and horizontal indents in the drawing area may be specified Whether the diagram should maintain its aspect ratio or fit to the drawing area may be specified when used in conjunction with programs such as Reliability Workbench which contain multiple software modules the category of diagram to be displayed may be selected.

As with graph and text reports, diagram reports can be either printed out directly to color or monochrome devices or exported in Rich Text Format (RTF). The RTF file can then be imported into other products such as Microsoft Word where it could be combined into a larger document and then printed.

RCMCost – Intro – Part of Availability Workbench Suite

Reliability Centered Maintenance Software

* Predict asset performance
* Optimize your maintenance strategy
* Reduce operational risks
* Improve profitability
* Increase uptime and lower costs
* Optimize spares holdings
* Simulate predictive maintenance
* Meet safety, environmental and operational targets
* Supports standards such as SAE JA1011, MSG-3 and
* MIL-STD-2173(AS)

Bill Keeter – Improving Asset Performance – Engineering Trainer / Consultant) – Using Availability Workbench

Bill Keeter (CMRP, CRL, CAMA, CPAM, Reliability Engineering Trainer & Consultant) shares techniques on how to best utilize Isograph's Availability Workbench software.

Powerful simulation software for improving asset performance. Maintenance and spares optimization, availability studies, reliability centered maintenance, life cycle cost evaluations and accelerated life testing all in one integrated suite.

Connect directly to your SAP or MAXIMO system and analyze your data
Identify critical equipment
Automatically build failure models using Weibull analysis
Optimize your maintenance plans using simulation and reduce costs
Predict system availability and optimize your design
Model system dependencies with RBDs or fault trees
Build in operational rules for accurate performance simulation
Determine the most effective spares holding policy
Predict life cycle costs
Analyze your test data for stressed failures in the ALT module
Identify plant performance trends in the Process Reliability module

www.isograph.com

Reliability 2.0 paper “Monte Carlo Simulation as an Aid to Optimization”

This spring there will be a lot of activity in Las Vegas. Some will be calculating their losses from March Madness, others will be finishing Spring Break with a yard of ale on the strip and David Wiseman and I will preparing to present our paper "Monte Carlo Simulation as an Aid to Optimization" at this years Reliability 2.0 conference. Reliability 2.0 Agenda April 7-11, 2014

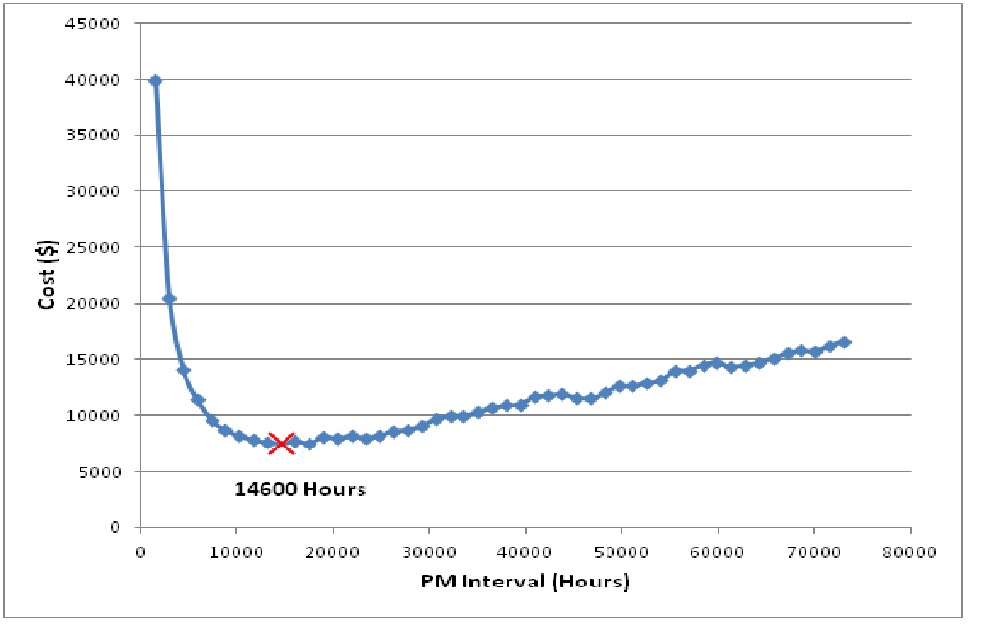
Monte Carlo simulation techniques allow computer programs to emulate plant behavior and quickly assess the effects of alternative PM policies. In this presentation we will demonstrate how to optimize PM intervals. We will also show how simulators may be used to optimize spare part storage levels – a vital consideration when restocking is subject to long lead times. Such optimization techniques can help to reduce maintenance and spare part storage costs, while taking into account safety, operational and environmental risk.

WeibullCurve

Isograph will be supporting this years Reliability 2.0 event by presenting 2 papers and exhibiting at the conference.

Let's Keep In Touch!

Subscribe to our newsletter to get the latest information on Isograph software.


By submitting this form, you are consenting to receive marketing emails from: . You can revoke your consent to receive emails at any time by using the SafeUnsubscribe® link, found at the bottom of every email. Emails are serviced by Constant Contact