There’s always something new to learn by revisiting the fundamentals. While this schematic and fault tree logic may seem straightforward, watching someone else break down the logic can offer fresh insights. In this session, our Senior Technical Advisor, Dr. David Wiseman, will give you a glimpse into his approach to analyzing the logic in this simple schematic.
Webinar recap, we'll guide you through building a Functional Safety Model in FaultTree+. Using a generic IEC 61508 Safety Integrated System as an example, we'll demonstrate how to create and structure your model effectively, whether you are following IEC 61508, IEC 61511, ISO 26262, or ARP 4754.
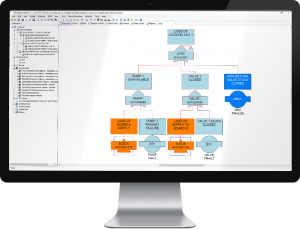
Schematic Example:

This was one of our most popular webinars to date.
"The only bad question is the one left unasked."
We always encourage a safe environment where open communication and the idea that asking questions is key to learning and growth. The nice thing about the Q&A from this meeting is that some of the questions were answered by our technical staff and some of the questions were answered by users of our products. I appreciate the involvement and participation of the users in this meeting!
Our next meeting on November 12 will introduce more advanced RAM modelling. RAM models can be quite simple, using only RBD logic, MTTF and MTTR data. But using Monte Carlo Simulation (MCS) opens up the possibility of modelling more complex behaviors, such as wear out, maintenance, rotation, etc.
Register here: HERE
List of Questions and Anwers from the meeting:
| Question | Answer |
| Shouldn't the top event be "Block Valve FC1 and Block Valve FC2 fail to close when required"? | In a Fault Tree, the TOP gate represents the Hazard or system failure you wish to model. In this instance it is a dangerous failure of the high integrity pressure protection system (HIPPS). In a simple system like this, the failure of the valves to close would be the a cause of the problem, but does not describe the hazardous scenario. Furthermore, in a more complex system, this would be rto specific a description and would fail to account for other possible causes of the hazard. |
| Is the description within the top event too vague? | As above, it is important to have a description encompasses the hazardous scenario. Though there is an argument to me made that 'Dangerous failure of HIPPS' would be a better description, as the HIPPS could also fail in a safe state if the valves where to fail closed, or the sensors were to send a spurious high pressure signal! |
| valve x 'or' valve y fail instead of 'and' | In this system, the valves close to stop the flow. Only one valve is required for this function, meaning that a dangerous failure only occurs if both valves fail to close. Hence the use of an AND gate. Bear in mind that a fault tree deals in failure, not success - i.e. what combination of failures would lead to a failure. |
| it is only parallel for the "unwanted open" state. for "unwanted closed" it is actually series | The Special Function menu has a Convert Fault Trees to Dual Trees option. This reverses the logic. (e.g. AND becomes OR, etc) |
| Is variant management possible in RWB? | Yes, RWB Enterprise Version allows for version control and comparison. |
| Sir David, in the system, how would you model the potential interactions between them that could lead to a cascading failure? Is there a specific approach to address these risks in Isograph? | This is actually best modelled using a numerical method, such as Monte Carlo simulation. FTA uses probability calculations which do not account for dynamic behaviors (e.g. failure rate of A dependent on status of B). The next webinar will go into this in more detail. |
| Is the description within the top event too vague? | Please see 5. |
| Is it un/reasonable to have different events using different failure rate models? | It is perfectly reasonable - even common - to have different events use different models. This was only a simple example that used one model type. |
| Will that still result into a meaningful calculation? | Yes, the calculation would still be meaningful. |
| Can we configure configuration factor CMooN per IEC 61508? | I believe this is covered by the IEC 61508-6 beta factor calculation feature. It allows you to select the level of MooN voting and adjusts the beta factor accordingly. This feature is accessed via the CCF model properties dialog, by select the Apply IEC Model option. |
| What is Modularization>? How to select? | Modularization is the process by which the software solves the probability of each gate independently where possible, before using it in the calculation higher up the tree. This process is applied automatically by the program, and dramatically improves calculation efficiency and, for some very complex trees, improves accuracy as well. Note that modularization is only performed for gates with no dependencies. (e.g. no shared events, no CCF models, etc) Modularization may be turned on/off in the properties dialog of each gate. |
| Is Route 2H included for HFT? | Route 2H is not currently included. However, we have this logged as a likely update to a future version of the Fault Tree software. |
| Is it possible on the software to look at the calculations for the various individually calculated figures? this would allow problem solving should something not be as expected | Yes. It is possible to instruct the program to store results for any and all gates in the tree. This Retain Results option may be turned on for individual gates in the properties dialog, or globally via the Analysis menu. It is also possible to display results for individual events using the View options dialog. (View, Options menu option) |
| Are there are any plans to produce a monte-carlo based FT analysis and if not, why? | MCS-based FTA is possible in the AvSim module of Availability Workbench. |
| Thanks Rachel! Does this work like a standard RAM package would I.E. using block diagrams? Or can it run FTs dynamically, i.e. for 500 cycles using distributions as required? | AvSim will let you build either RBD or FT diagrams. |
| For more complex FT models, is it possible to get a Results Report (in Excel or similar format) with all Gates / Events Unavailability? | Yes. All results from both gates and events may be displayed in the form or a report and exported to CSV, which may then be opened in Excel. |
| Similarly, is it possible to get a Results Report (in Excel or similar format) with all combinations of cut-sets and associated unavailability? | There is a cut set report template provided with the software that will display all cut sets for a selected gate. While it is possible to show sets for all gates in one report, this would require a custom report template. |
| You might cover it later, but can the tool identify the optimum inspection interval to achieve a target HIPPS failure rate? | For this I recommend the Special Sensitivity analysis. I think I mentioned briefly but did not have time to show it in detail. This is a feature that allows you to iteratively change an event parameter, such as proof test interval, and see the impact on a top gate result parameter. This would help you to select an optimum interval. |
| For bigger FT models is it possible to export a FT model structure (to pdf or picture format) without using printscreen? | Yes, you can open the Diagram report and then print to PDF using the built in export functionality in the Reporting tool. |
| How do you quantify the degradation of materials in different conditions? For example, if a tube is exposed to salt water, the degradation of the tube is much higher compared to fresh water. Is there a way to incorporate this into a fault tree? | The Weibull failure model provides some scope for dealing with fatigue and wearout, as does the built in Markov analysis tool. (not covered in the presentation) Note that the FTA is still only performing a probability calculation, so would only use a mean or point probability for the wear out event. It cannot be modelled dynamically. For this you would need a numerical solution like Monte Carlo simulation. |
| can the library function be used in RBD as well? | Yes, the project library functionality is available in all modules of RWB. The parts libraries work with Prediction, FMECA, RBD and FTA. |
| i mean the library of data that we used in one project, not the generic data library | Please see above. |
| so data i used in FT, can also become library for RBD? | Yes, generic failure models created in FTA can be used in RBD and vice versa, including via a library. |
| Within RWB FT+ is there an option to model exponential distributions, if so how? | The Rate model (and related models, like MTTF and Rate-MTTR) follow an exponential distribution, i.e. probability has an exponential relationship to time. |
| What is the unavailability resolution (%) of availability workbench? | This will depend on the amount of statistics collected. The lifetime simulations you can perform, and the more failure events occur during an analysis, the lower the statistical error will be. |
| Can you import data/libraries from Availability Workbench directly into RWB, and vice versa? | Yes. Using 'File, Save as…' you can save an AWB project using the .awbx file format. This can then be opened in RWB using the Import AWB Project File option in the File menu. The reverse is also true. FTA and RBD data may be exchanged with AvSim, and FMECA data with RCMCost. |
| i am using your company workbench availability for RAM study, what is the difference between this one and that one? are there any way to import database from one to the other? | The primary difference is that AWB uses simulation to calculate results, making it ideal for RAM modelling, maintenance and spares optimization, and life cycle costs. RWB uses standard probabilistic methods for reliability analysis, making it well suited to functional safety analyses, amongst others. Regarding exchange of data between tools, please see above. |
| Will this webinar be made public? | Yes. A link to the YouTube video will be provided. |
I look forward to any questions, comments or ideas you have for future meetings.
Best Regards,