Howdy, folks. As Jeremy mentioned, we recently returned from Hawaii, where we were forced to go for the Probabilistic Safety Assessment & Management conference. We tried not to have too much fun in the sun between conference sessions. I also presented a paper, and I swear I had no idea where the conference was going to be when I submitted my abstract to the organizers. 😉 Anyways, the topic of my paper is great material for a Tech Tuesday post: Using Fault Trees to Analyze Safety-Instrumented Systems.
Safety-Instrumented Systems
Safety-Instrumented Systems (SIS) are designed to mitigate the risks of safety-critical processes or systems. Safety-critical systems are those that, if not properly maintained or controlled, can malfunction in such a way as to cause a significant risk to safety or another hazard. Examples of critical systems or processes are nuclear reactors, oil refineries, or even an automobile.
The SIS is designed to engage when the critical system experiences a failure. The SIS will automatically detect unsafe conditions in the critical system and prevent a hazard or restore the system to a safe state. An example of this might be an automated emergency shut-down in a reactor vessel, or even the airbag in a car. Due to their nature, SIS have stringent reliability requirements. When designing one, you need to know that it will work when required. This is where Fault Trees come into play. Using analytical FT methods, Reliability Workbench can evaluate the reliability of a SIS and help you determine its probability of failure on demand (PFD).
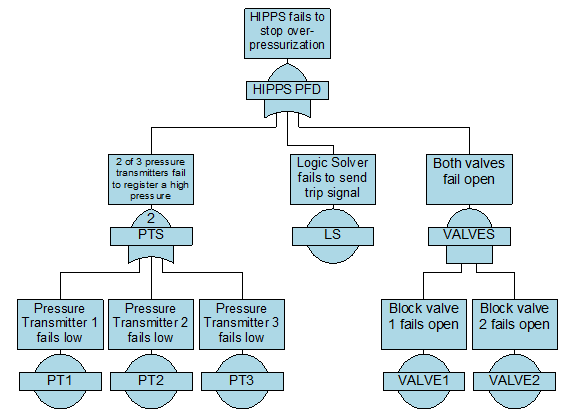
Take, for example, a high-integrity pressure protection system (HIPPS). This SIS is frequently see n in chemical plants and oil refineries. It is designed to prevent an over-pressurization event in a fluid line or vessel, by shutting off the input of the fluid.

The example here consists of three pressure transmitters (PT), a logic solver, and two block valves. Two-out-of-three (2oo3) logic is applied to the pressure transmitters, meaning at least two of them must register the high pressure in order for the system to trip. Only one of the two block valves must close in order to stop the fluid flow. We can build a Fault Tree to represent this logic as such:
Failure Data
If you've read one of the standards that discusses safety-instrumented systems, such as IEC 61508, 61511, or ISO 26262, you may have seen this graph, representing the four failure modes of a typical component.
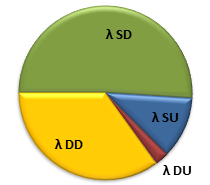
λ SU: Safe, Undetected
λ DD: Dangerous, Detected,
λ DU: Dangerous, Undetected
Safe failures are those that don't contribute to the PFD of the SIS, such as if the pressure transmitters in our HIPPS fail high. This failure won't inhibit the ability of the safety system to engage, since they are sending the signal to trip the SIS. Dangerous failures do contribute to PFD, like if the block valves fail open. Detected failures are those that are immediately known and can be corrected. Undetected failures remain hidden unless you test the component to see if it's still working. For Obvious Reasons, the dangerous, undetected failures are of the most concern.
In Reliability Workbench 11, Isograph added an IEC 61508 failure model to the program. This allows users to easily enter information for all four quadrants here; you can tell the program the overall failure rate, the dangerous failure percentage, and the diagnostic coverage for both safe and dangerous failures. The IEC 61508 failure model also allows for imperfect proof tests, so you can tell the program that some undetected failures remain undetected even after testing.
Common Cause Failures
One of the most important considerations when evaluating SIS are common cause failures (CCF). Standard probability math tells us that the probability of two random events occurring simultaneously is just the product of each individual events' probability. That is, to determine the probability that, say a coin flip lands heads and a die roll comes up 6, just multiply the probability of the coin landing heads by the probability of the die showing 6.
However, in SIS this is rarely the case due to common cause failures. CCFs basically mean that the random failures are not so random, and that components may be more likely to fail at the same time than you'd otherwise expect. For instance, the redundancy of the block valves means that you'd expect the probability of both of them to be failed to be the square of the individual probability of failure. However, due to CCFs, they are more likely to happen at the same time.
Reliability Workbench has a method of easily incorporating CCFs into the calculations. The most common method for taking these into account is called the beta factor model. With the beta factor CCF model, you can tell the program that a given percent of failures of a component are due to common causes, and all other components like it will also fail. For instance, we might say that the valves have a beta factor of 5%, meaning that 95% of their failures are random and independent, while the remaining 5% of failures of one will be due to causes that will also affect the other.
Logic Before Average
You may have heard that Fault Trees are unsuitable for solving SIS because of the way that the underlying Boolean algebra handles averaging probabilities. To an extent, what you've heard is correct. Typical Fault Tree methods can often provide optimistic results, predicting a PFD about 80% of the actual value. This is because Fault Tree methods first take an average PFD for each event, then apply the addition and multiplication laws of probability to solve for the system logic. However, SIS standards give equations that do the reverse. That is, they first apply logic, then solve for a PFD average. Since for a given function, the product of the means is not necessarily equal to the mean of the products, these two methods can produce different results.
To account for this, Reliability Workbench provides a special "logic before average" calculation method, which brings its results in line with the answers calculated using IEC 61508 methods. These proprietary calculations were first included in FaultTree+ v11, released in 2005.
Spurious Trips
Spurious trips are failures of the safety system, but in a "safe" way. That is, they are false alarms, where the SIS engages when no hazardous condition was present, due to safe failures of the components. For instance, if two of the pressure transmitters in our HIPPS were to fail high, this would send a signal to engage the SIS, even though there was no actual high pressure. While spurious trips often don't carry the same hazardous consequences that a dangerous failure does, the can be annoying and costly, because they probably involve stopping a process, which may take several hours to restart, leading to loss of production.
In some serious cases, spurious trips are more safety-critical than demand failures. Consider, for instance, the airbag on your car. If it fails to go off when needed, there's a greater chance that you'll be injured than if it had deployed. However, if it deploys when not needed, say when you're driving along at 70 mph on the highway, then it can cause you to lose control of the car and cause an accident.
One very useful feature about using Reliability Workbench to analyze SIS is the inclusion of features to easily perform spurious trip analysis. If your using the IEC 61508 failure model, then you've already entered information pertaining to safe failure rate. If you just apply some logical reversals—and again, there's a feature to automatically do this for you—then the Fault Tree can very easily be reconfigured to solve for the mean time to fail spuriously (MTTFspurious).
| PFDavg | λ (/hour) | MTBF (hours) | RRF | Spurious trip rate (/hour) | MTTFspurious (hours) |
| 4.7E-3 | 6.193E-7 | 1,622,000 | 212.8 | 6.165E-6 | 162,200 |
HIPPS final analysis
There was one more section to my PSAM 12 paper, but I've already discussed it here: importance and sensitivity analysis. If you're interested in leaning more about this, Isograph offers a two-day SIS in Fault Tree training course, which covers Fault Tree basics and shows how to model complex SIS logic in the Reliability Workbench.
So there you have it; while our wives were stuck outside, basking in the sun and drinking tropical beverages from coconut shells, Jeremy and I were having a grand time at the conference, talking about how great Fault Trees are for analyzing SIS. I'm sure our wives were so jealous that they weren't able to attend the presentation.