Howdy, folks! I've just returned from a training session in Houston, Texas, all about using FaultTree+ to assist in an IEC 61508 SIL analysis. I'll have a post up about that sometime later. Today, though, we'll talk about a topic hinted at in last month's Tech Tuesday: the use of Importance Analysis and Special Sensitivity Analysis.
Picture this: we've just completed an in-depth Fault Tree and risk analysis of our chemical reactor shut down system, from last week. We've determined that the point risk for our system is 4.318E-6 fatalities per year, or about one fatality per 231,600 years. That seems pretty good, but let's suppose that due to industry regulation, or corporate standards, or customer requirements, we've been assigned a reliability goal of 1E-6 fatalities per year, or one fatality per million years. This means that, in order to meet our acceptable risk target, we'd have to lower our risk by a factor of 4.318. How do we figure out the best way to do that?

There are two useful tools for figuring out the best way to improve reliability, either in a new design or in an existing system. Importance analysis can tell use the weak points in our system. Special sensitivity analysis will show how changing input parameters will affect the system reliability.
Importance Analysis
Importance analysis works by figuring out how much each component contributes to system unavailability. There are a few different importance measures, but probably the most useful and most used is called Fussell-Vesely importance. This importance measure tells us, basically, what percent of system failures involved each component. Another way of saying that would be the Fussell-Vesely importance tells us how much better reliability would be if the component never failed. A high Fussell-Vesely importance indicates a high contribution to system down time, meaning the component is a weak point in the system.
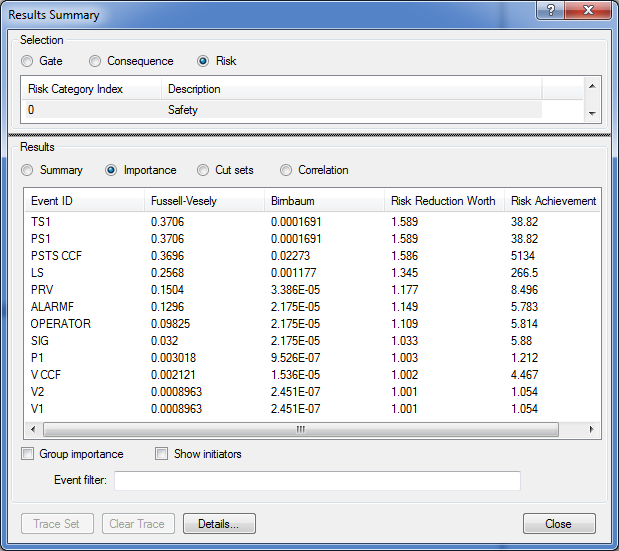
In our example, by performing importance analysis, we can figure out which component failures were the biggest contributors to risk.
The temperature sensor (TS1) and pressure sensor (PS1) in our safety system have the biggest F-V importance ranking, followed by the common cause failure of those two components. This makes sense because, if you remember the system, two layers of protection are dependent upon the proper functioning of the sensors.
This gives us an idea of where to get the most bang for our buck when trying to improve system reliability. Improvements to the sensors will take us a lot farther than improvements to the isolation valves (V1 & V2).
Sensitivity Analysis
Now, how much better would our valves have to be in order to meet our 1E-6 risk goal? We could use trial and error, entering different failure inputs parameters, re-running the analysis, then checking the results, or we can use Special Sensitivity Analysis. SSA is an automated method that will vary input parameters and then report back to us on how the variation affects results.
To apply sensitivity analysis to our system, we'll tell Reliability Workbench to modify the test intervals for the components in our system and record how this change affects risk. In our baseline case, the test interval is six years. We'll try a range of test intervals less than that and see which one allows us to meet the safety goal.
| Test interval (months) | Safety risk |
| 12 | 6.843E-7 |
| 18 | 9.571E-7 |
| 24 | 1.26E-6 |
| 36 | 1.899E-6 |
| 48 | 2.635E-6 |
| 60 | 3.572E-6 |
So, a test interval of 18 months will meet our safety goal of no more than 1 death per million years.
Sensitivity analysis can be used to adjust more than just test intervals, and examine the impact on more than just risk. For instance, how does using a component with a lower failure rate impact system unavailability? How does changing the MTTR affect risk reduction factor?
Be sure to check out the FaultTree+ module of Reliability Workbench to test out the importance analysis, sensitivity analysis, and many other features!
