Howdy, folks. As Jeremy has mentioned, this past Friday, April 4th, we hosted a webinar to demonstrate Isograph's FaultTree+ tool. One of the topics we discussed was how you can use the Fault Tree and Event Tree features of the tool to perform a quantitative Layer Of Protection Analysis (LOPA). This post will serve as a little summary of that meeting, for anyone who was unable to attend.
The first stage of a LOPA might be done externally to a quantitative tool like Fault Tree. The first thing you'd want to do is identify hazards, determine an acceptable risk level for those hazards, and ask what you're doing to mitigate them. This might have more in common with a Hazop study. Once you've identified your hazards and protection layers against those hazards, the next thing you might want to do is quantify it. How often will the hazard occur? How effectively will our layers of protection mitigate the risk of the hazards? Can we objectively rank these risks? This sounds like a job for Fault Tree and Event Tree analysis.
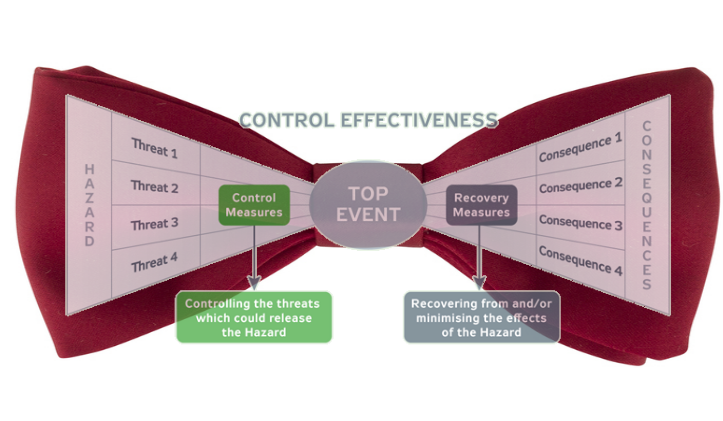
A Fault Tree can very easily be used to quantify a hazard. In fact, that's the primary usage of the method. By coupling it with an Event Tree, we can find out how well that hazard is mitigated by protection systems. If you're not familiar with it, Event Tree analysis is related to Fault Tree analysis. It uses a similar quantitative calculation. The difference is that, while Fault Trees examine the failure leading to a hazard, Event Trees examine the consequences following the hazard. Sometimes, when coupled together, they're called "bowtie events".
Continue reading "Tech Tuesday: Quantitative LOPA with FT/ET"
