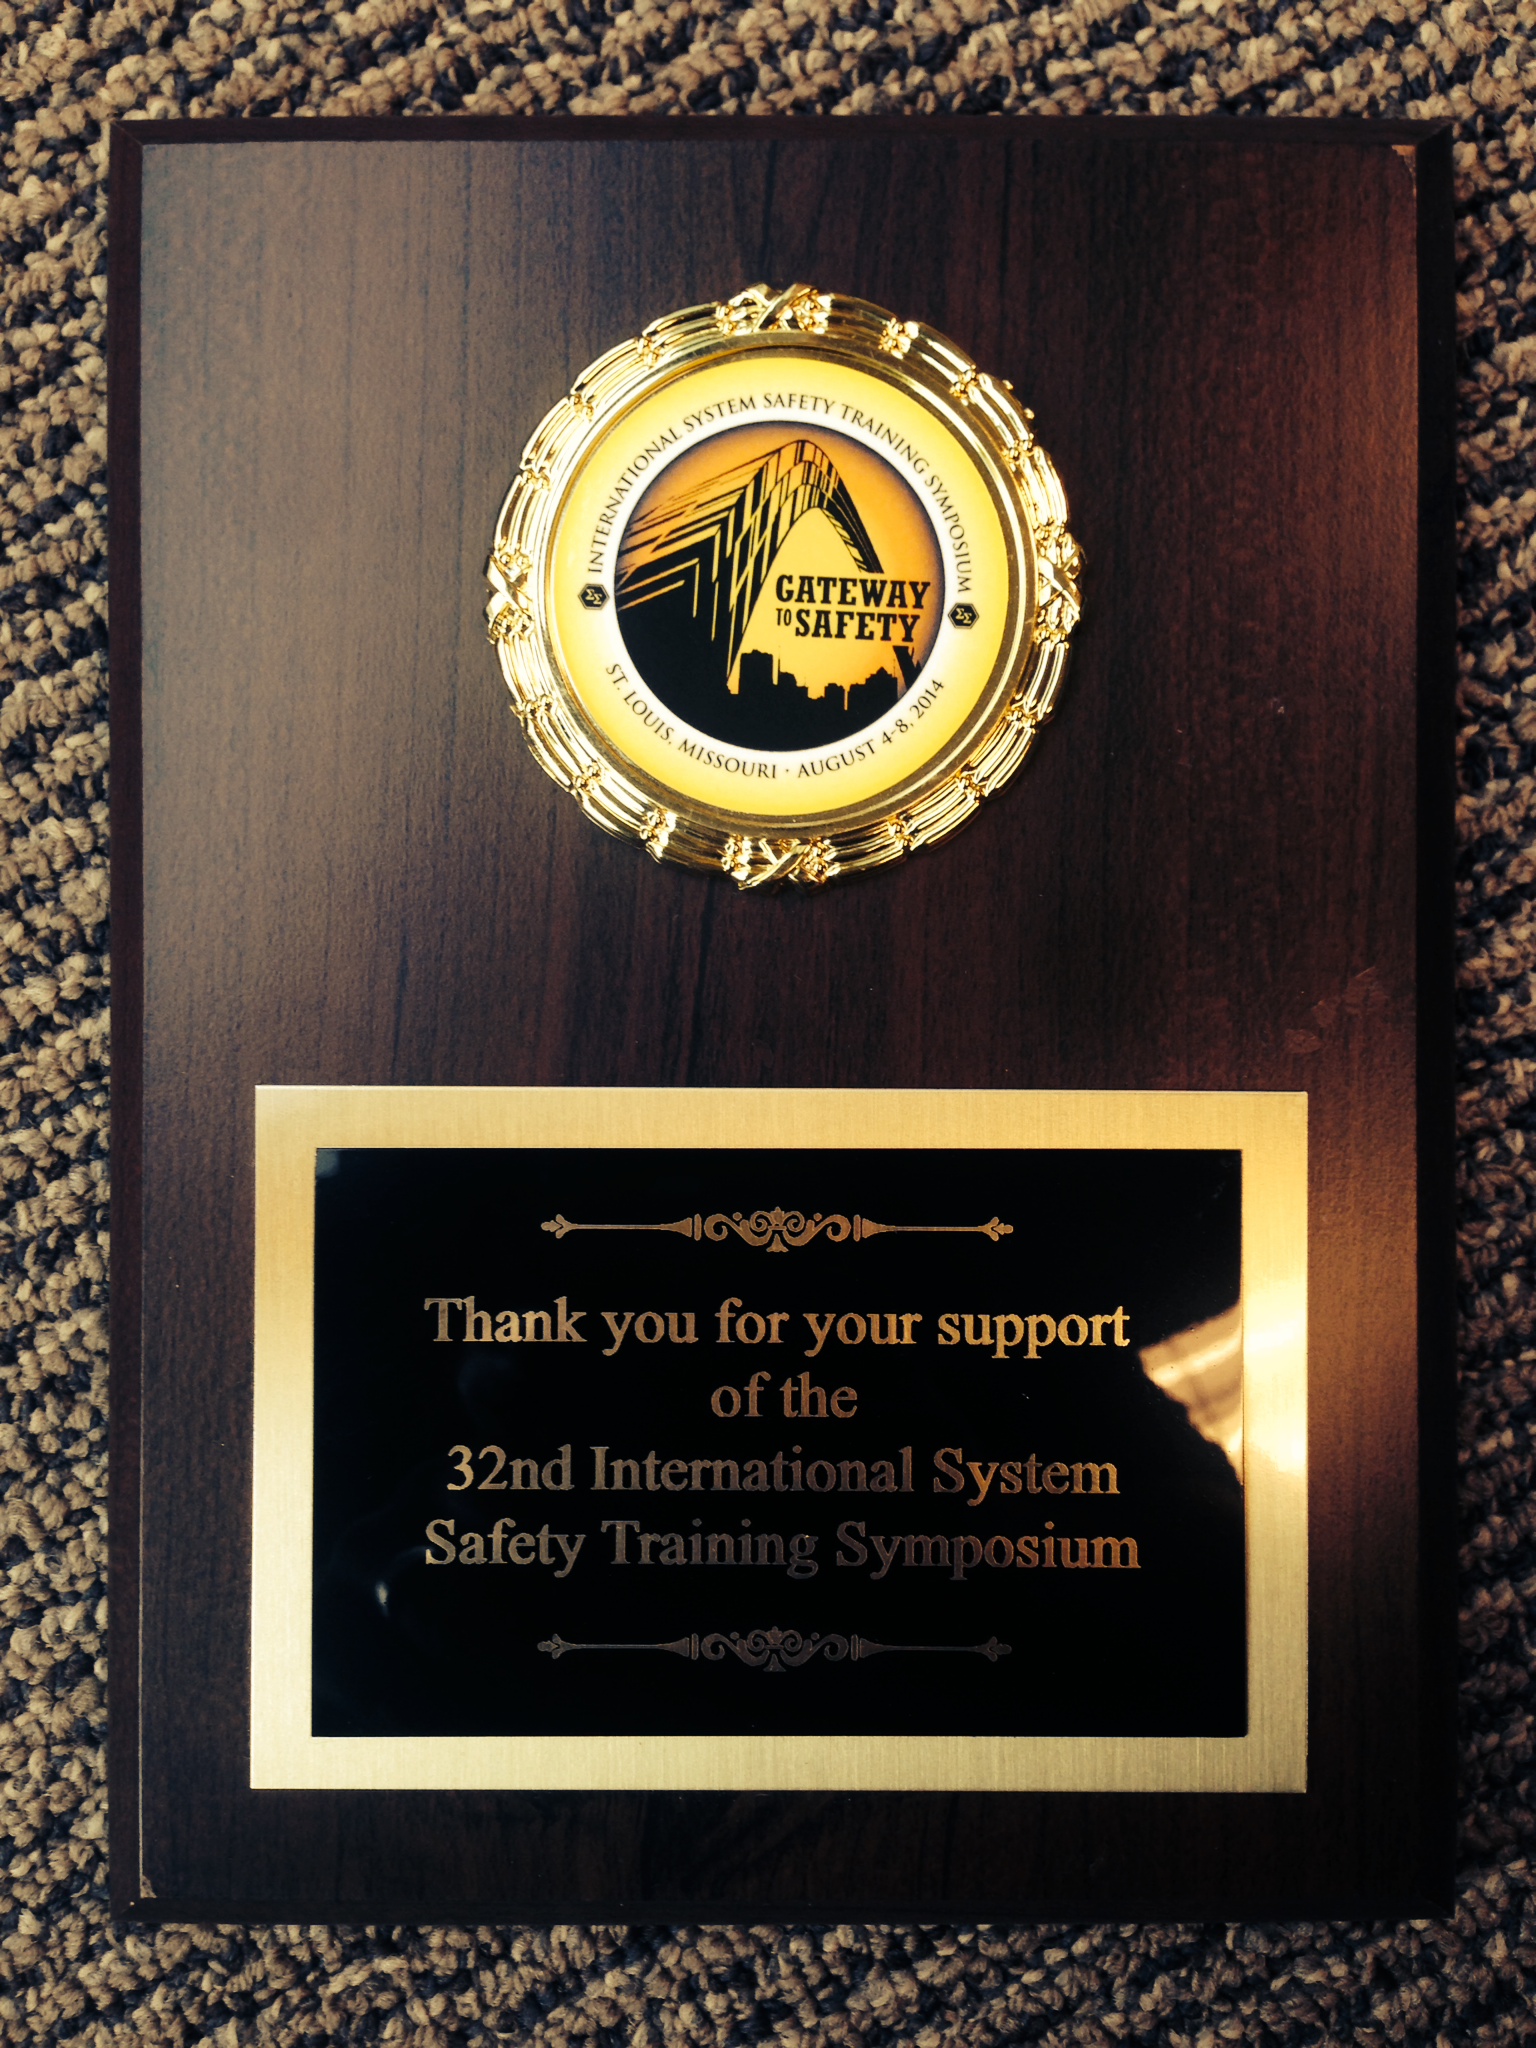
On August 4-8 Isograph sponsored the International Systems Safety Conference in St. Louis. This conference was the 32nd International System Safety Training Symposium. We enjoyed a great training symposium that focused on topics related to system safety discipline. Although any industry could benefit from this conference it seems to be engineers primarily from the aerospace industry attending this conference. Engineers take the time to exchange ideas, knowledge, experiences and best practices which gives the opportunity to learn from each other and share safety processes, methods, and techniques that advance the goals and objectives of the system safety profession. Isograph has now been supporting the Systems Safety Conference for almost 2 decades. To learn more about the Systems Safety Conference please go to their website: http://www.system-safety.org
Author: jhynek
PSAM 2014 Honolulu
 This years PSAM took place on the beautiful island of Oahu, Hawaii. Begrudgingly we packed our bags last week and headed to Hawaii. Although I might have been hoping for some sun and surf the conference was all business. The Probabilistic Safety Assessment & Management conference is a conference in risk, risk management, reliability, safety, and associated topics. Historically this conference has been attended primarily by the nuclear industry. This years PSAM was a mixture of several different industries, the nuclear industry making up about half the attendees.
The PSAM conference brings together experts from various industries. The multi-disciplinary conference is aimed to cross-fertilize methods, technologies and ideas for the benefit of all. PSAM meets internationally every two years. This years conference was in Hawaii, 2016 will be in Korea. http://psam12.org
2014 CIM Conference
This week Isograph attended the CIM (Canadian Institute of Mining) conference in Vancouver, http://vancouver2014.cim.org/ which was a great event. As software authors we usually don't get the chance to take a close look at the machinery that is often modeled in our software. The CIM conference not only gave us this chance it seemed to have a bit of everything including: 12 foot tires, 14 ton trucks, UAV's, drills, software and many items specific to the mining industry. Its also the only conference I have been to that had its own fireworks show!
CIM is a very mature organization which was founded in 1898, the Canadian Institute of Mining, Metallurgy and Petroleum (CIM) is the leading technical society of professionals in the Canadian Minerals, Metals, Materials and Energy Industries. CIM has over 14,600 members, convened from industry, academia and government. With 10 Technical Societies and over 35 Branches, their members help shape, lead and connect Canada’s mining industry, both within Canadian borders and across the globe. Canadian Institute of Mining - 2014
Reliability 2.0….. cliff notes
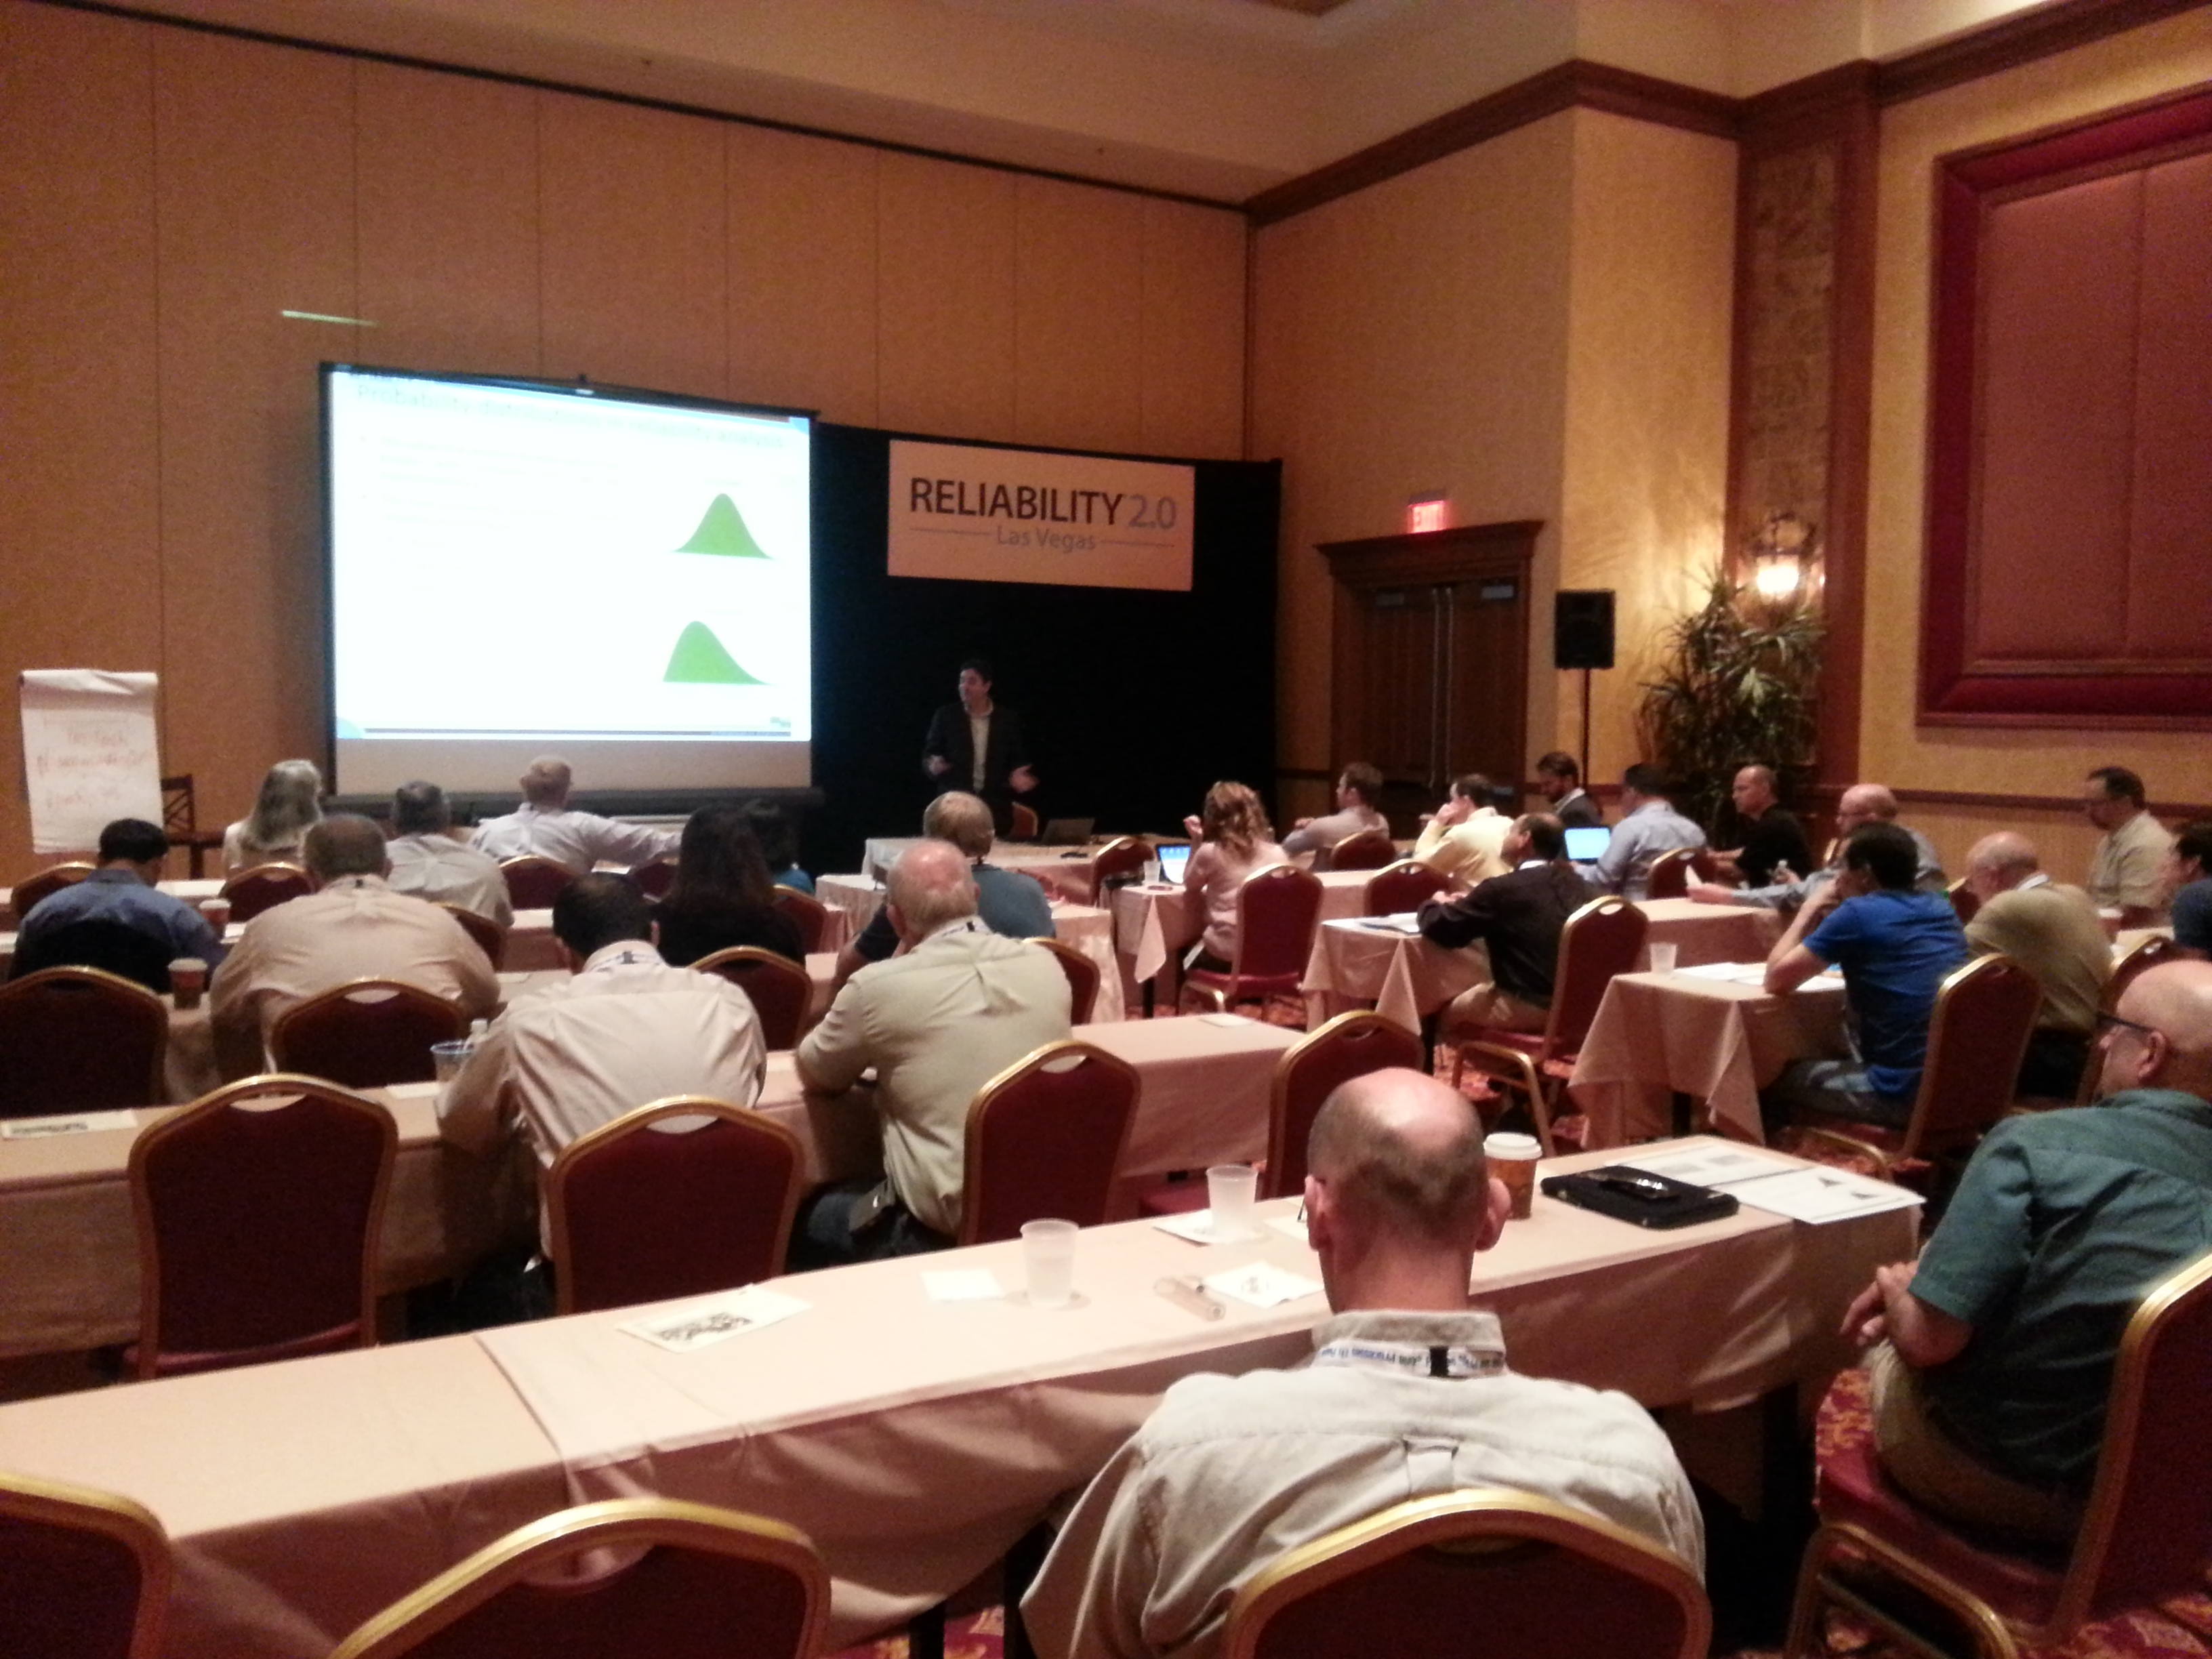
This years Reliability 2.0 meeting in Las Vegas was a great meeting with a bit of bowling, gambling and interesting discussions on topics like Monte Carlo Simulation. (Which seems like a fitting topic for Las Vegas.) Reliability 2.0 2014 included 2 papers authored and co-authored by Isograph employees. Dr. Gabriel Lima's (Isograph Partner) paper titled "Practical Models for Decision-Making in Asset Management" . As an economics professor Gabriel was able to give a unique point of view regarding what motivates asset management strategies. Factors such as increased reliability, improve availability, reduced unit cost, reduced risk and improved frequency of failure . Below is a photo from Gabriel 3 hour training course. If you are interested in the course notes please contact me jhynek@isograph.com .
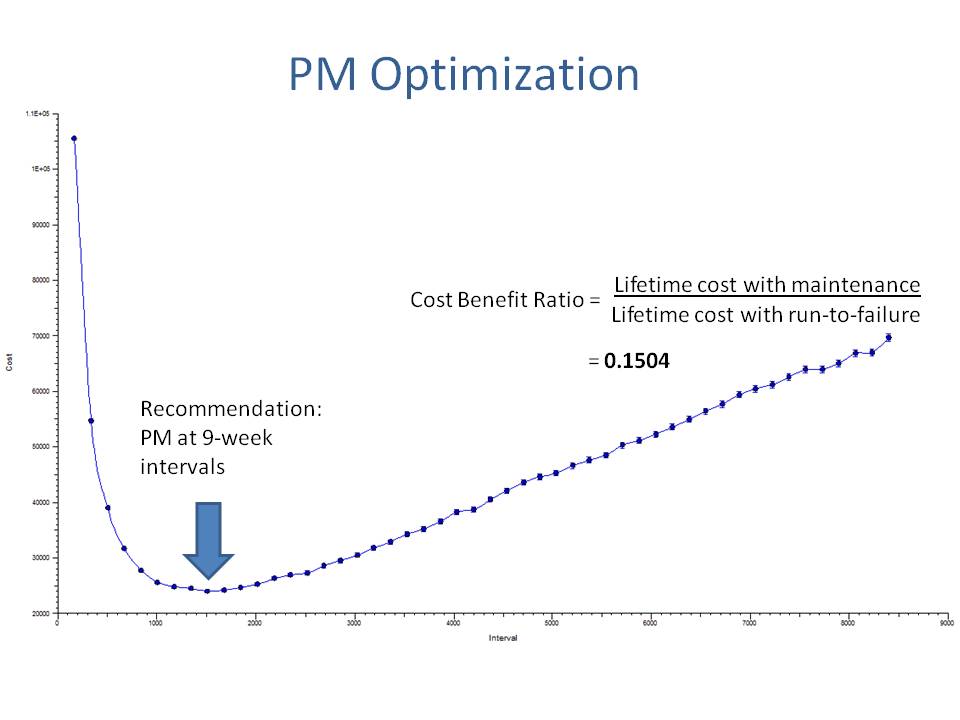
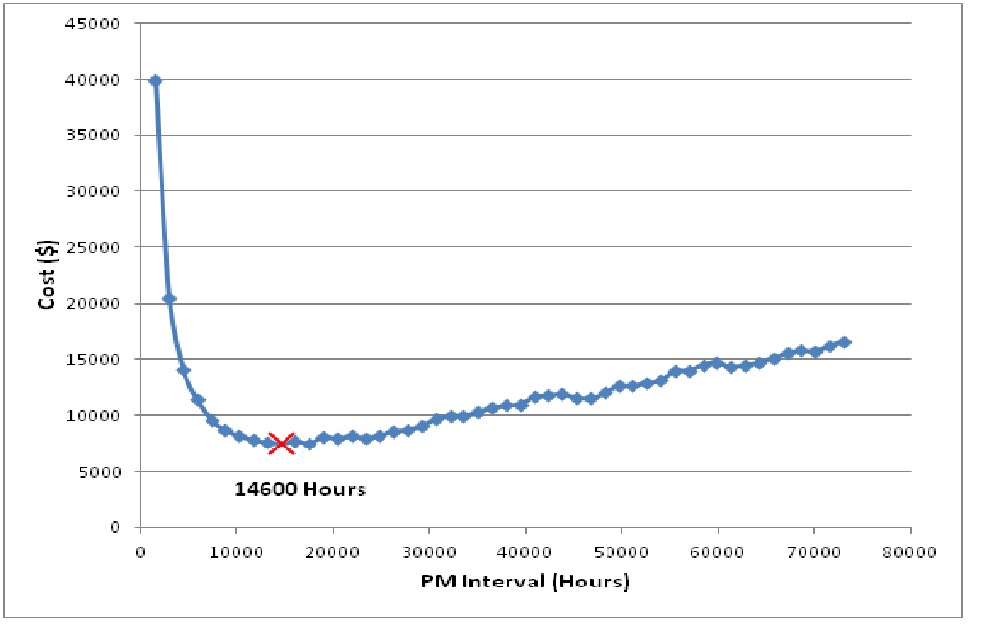
Dr. David Wiseman a die hard Liverpool soccer fan, nuclear physicist and employee of Isograph also presented a paper titled "Monte Carlo Simulation as an Aid to PM Optimization" . In this paper David clears up the common misconception that massive amounts of data are needed to perform a simulation to optimize your PM intervals. For a basic simulation all that is needed is the Mean Time To Repair (MTTR), the price of the PM interval and less than a weeks worth of test data. Using this data a recommended PM interval and Cost Benefit Ratio are easily calculated.
We all walked away from the conference with minor gambling losses and a better idea on how to approach our asset management models. For additional information please contact Isograph: 949 502 5919 jhynek@isograph.com , www.isograph.com
Performing a LOPA using FaultTree+
On Friday April 4th at 9am PST to learn more about applications of our FaultTree+ software. During this demonstration we will introduce our fault tree analysis software FaultTree+ and as an added bonus we will be discussing how to tie a fault tree to an event tree and perform a LOPA study. Layer of Protection Analysis, or LOPA, is a study developed to identify risk. By performing a LOPA on a system you can create a method for identify the actions available to mitigate the potential consequences of a particular risk. To do this we will start with likelihood of a particular hazard occurring, analyze the system using quantitative methods, and identify the mitigation measures against the hazards that have been identified.
Once the mitigating actions have been identified the probability of those hazards occurring can be reduced by implementing safeguards that bring the hazard into an acceptable level. An event tree is an excellent way to determine the consequences of successful, or the failure of, safeguards.
Basically, a LOPA is performed to identify the weakest points of a system and evaluate the safeguards in place to mitigate the consequences of that hazard.
To join this webinar: Register Here
EcoCar2…. what is it?
The EcoCar sounds very green but what is it? The EcoCar program is a 3 year student engineering program sponsored by the Department of Energy, General Motor and of course Isograph (among a few others). The competition includes 15 North American Universities. Students take a Chevy Malibu and compete to improve environmental impacts without sacrificing safety, reliability, performance or accessibility to consumers.
Although the concept of giving a bunch of college kids a Malibu to take apart and rebuild seems bit risky. The project has been a very beneficial endeavor for both the students and the sponsors. Most of Isograph's support went to the University of Ohio. http://ecocar2.osu.edu/ , according to their website, they decided to use a Parallel-Series Plug-in Hybrid Electric Vehicle (PHEV) architecture. The architecture includes an E85 engine, two Parker-Hannifin electric machines, an A123 battery pack, an automated manual transmission and a charging system. Which allows the Malibu to drive 50 miles before the gas engine turns on! Pretty amazing considering these kids would meet once a week and work on the car one day during the weekends.
For several years Isograph has supported students on the EcoCar. and EcoCar 2 programs. EcoCar3 is taking applications so the competition should be back on shortly. The competition can be followed on the DOE website: http://www.ecocar2.org/
Reliability 2.0 paper “Monte Carlo Simulation as an Aid to Optimization”
This spring there will be a lot of activity in Las Vegas. Some will be calculating their losses from March Madness, others will be finishing Spring Break with a yard of ale on the strip and David Wiseman and I will preparing to present our paper "Monte Carlo Simulation as an Aid to Optimization" at this years Reliability 2.0 conference. Reliability 2.0 Agenda April 7-11, 2014
Monte Carlo simulation techniques allow computer programs to emulate plant behavior and quickly assess the effects of alternative PM policies. In this presentation we will demonstrate how to optimize PM intervals. We will also show how simulators may be used to optimize spare part storage levels – a vital consideration when restocking is subject to long lead times. Such optimization techniques can help to reduce maintenance and spare part storage costs, while taking into account safety, operational and environmental risk.
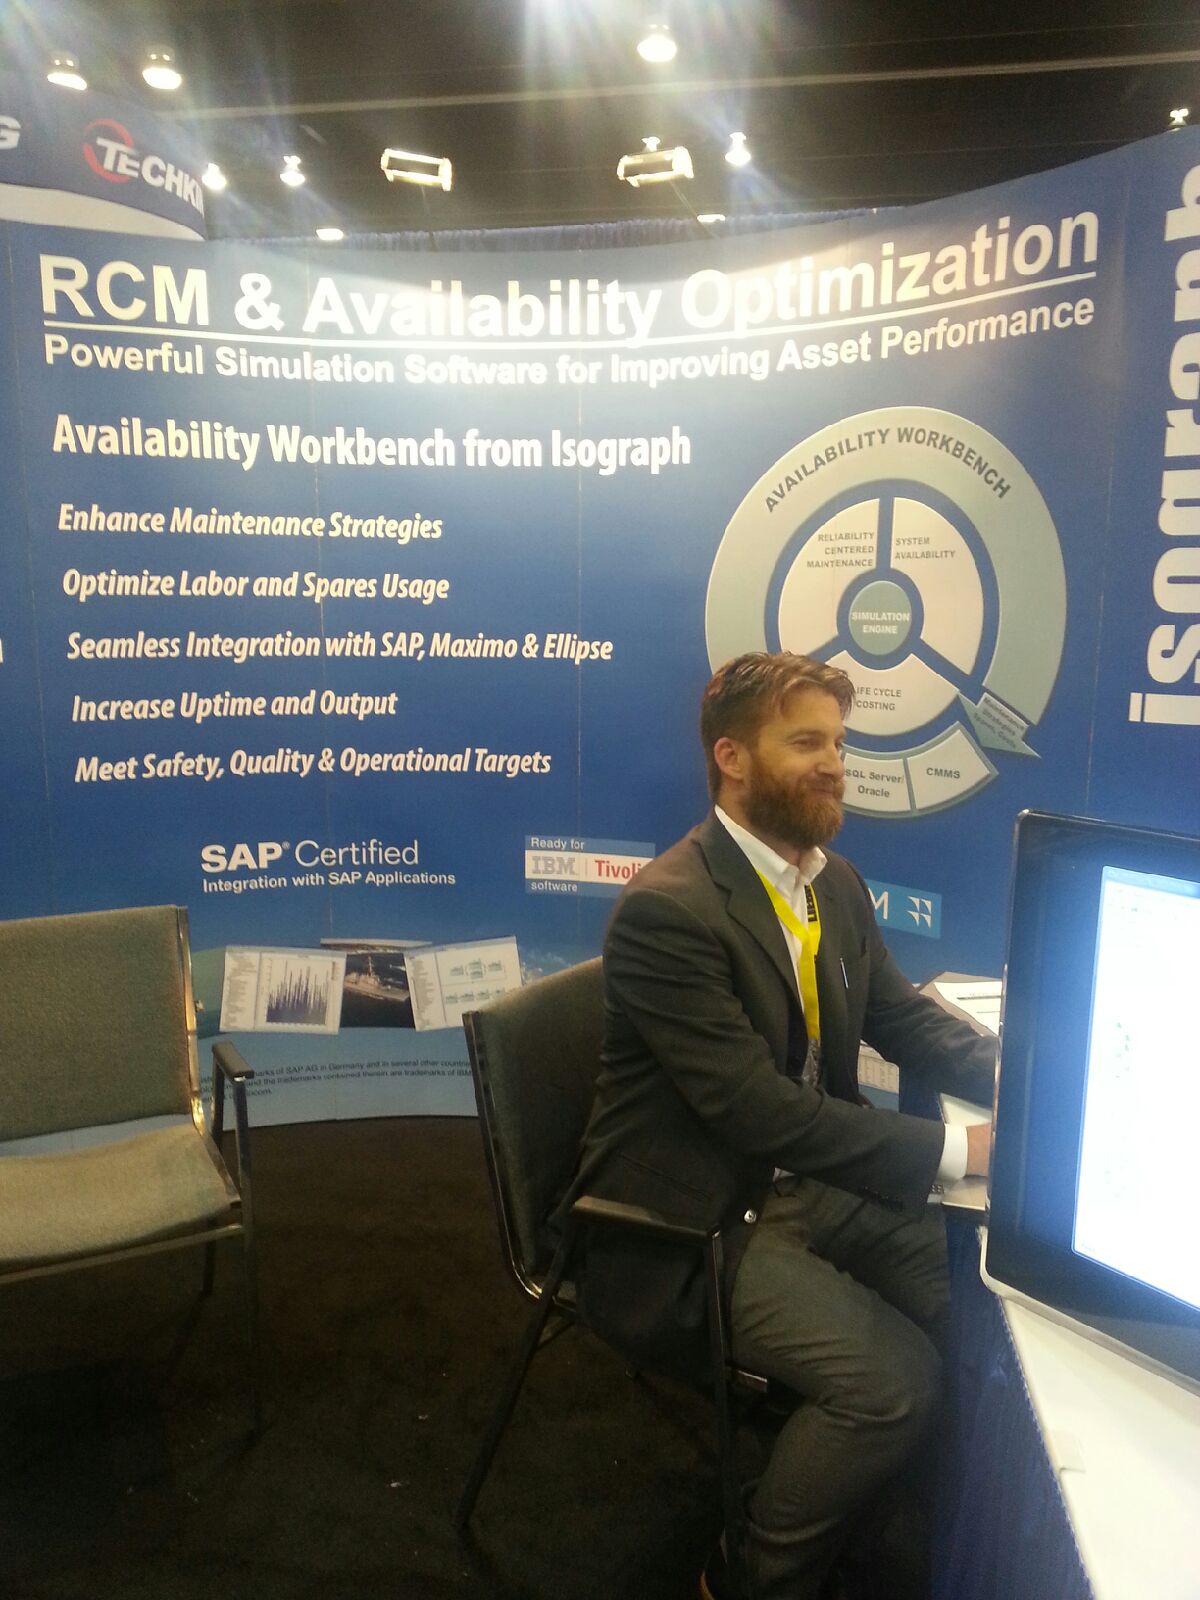
Isograph will be supporting this years Reliability 2.0 event by presenting 2 papers and exhibiting at the conference.
Tech Tuesday:
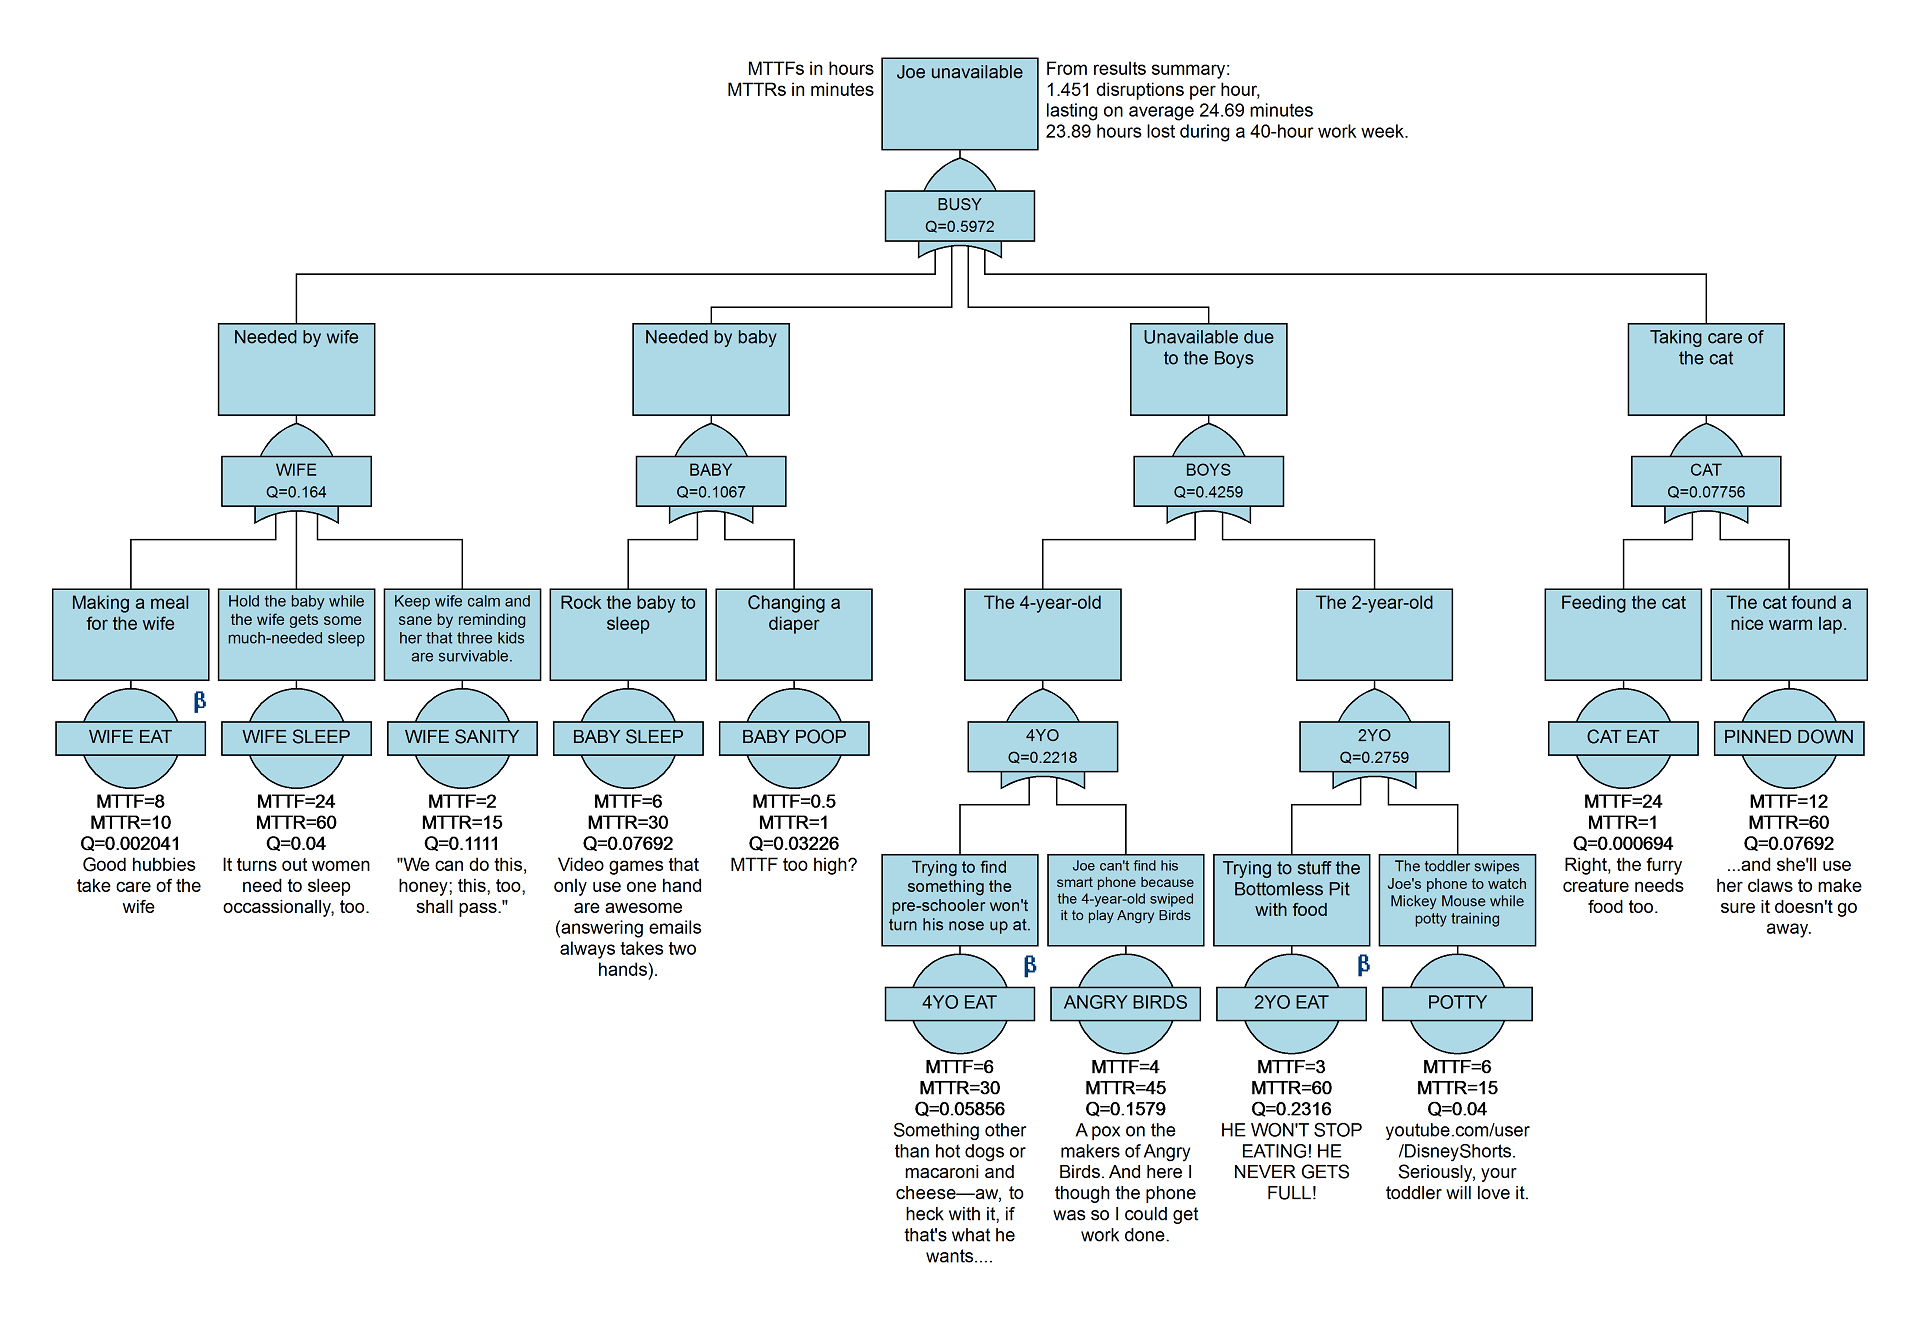
Congratulations to our North American Technical Lead, Joe Belland, who is out on paternity leave for a couple weeks. If your curious about what Joe is up to we had him breakdown his week in the fault tree diagram below. Although Joe will be missed for the next few weeks its business as usual here at Isograph North America. Joe and our support team will still be responding to support questions via email support@isograph.com and Jeremy Hynek will be answering Joe's phone 949 502 5749.
Joe wasn't able to write his weekly column before his baby girl was born, but he did put together this Fault Tree explaining why he might be in and out of contact for the next few weeks.
FaultTree+ Friday
Today I would like to address one of the most commonly asked questions by new users of our FaultTree+ software, which is: Copy and Paste vs. Copy and Paste Special. When used correctly Copy and Paste and Copy and Paste Special can be a huge time saver. If used incorrectly this feature can unintentionally be introducing Common Cause Failures (CCF) which can kill the reliability of a system or create copies of existing events or gates, which were intended to be CCF, making your tree more reliable than it should be.
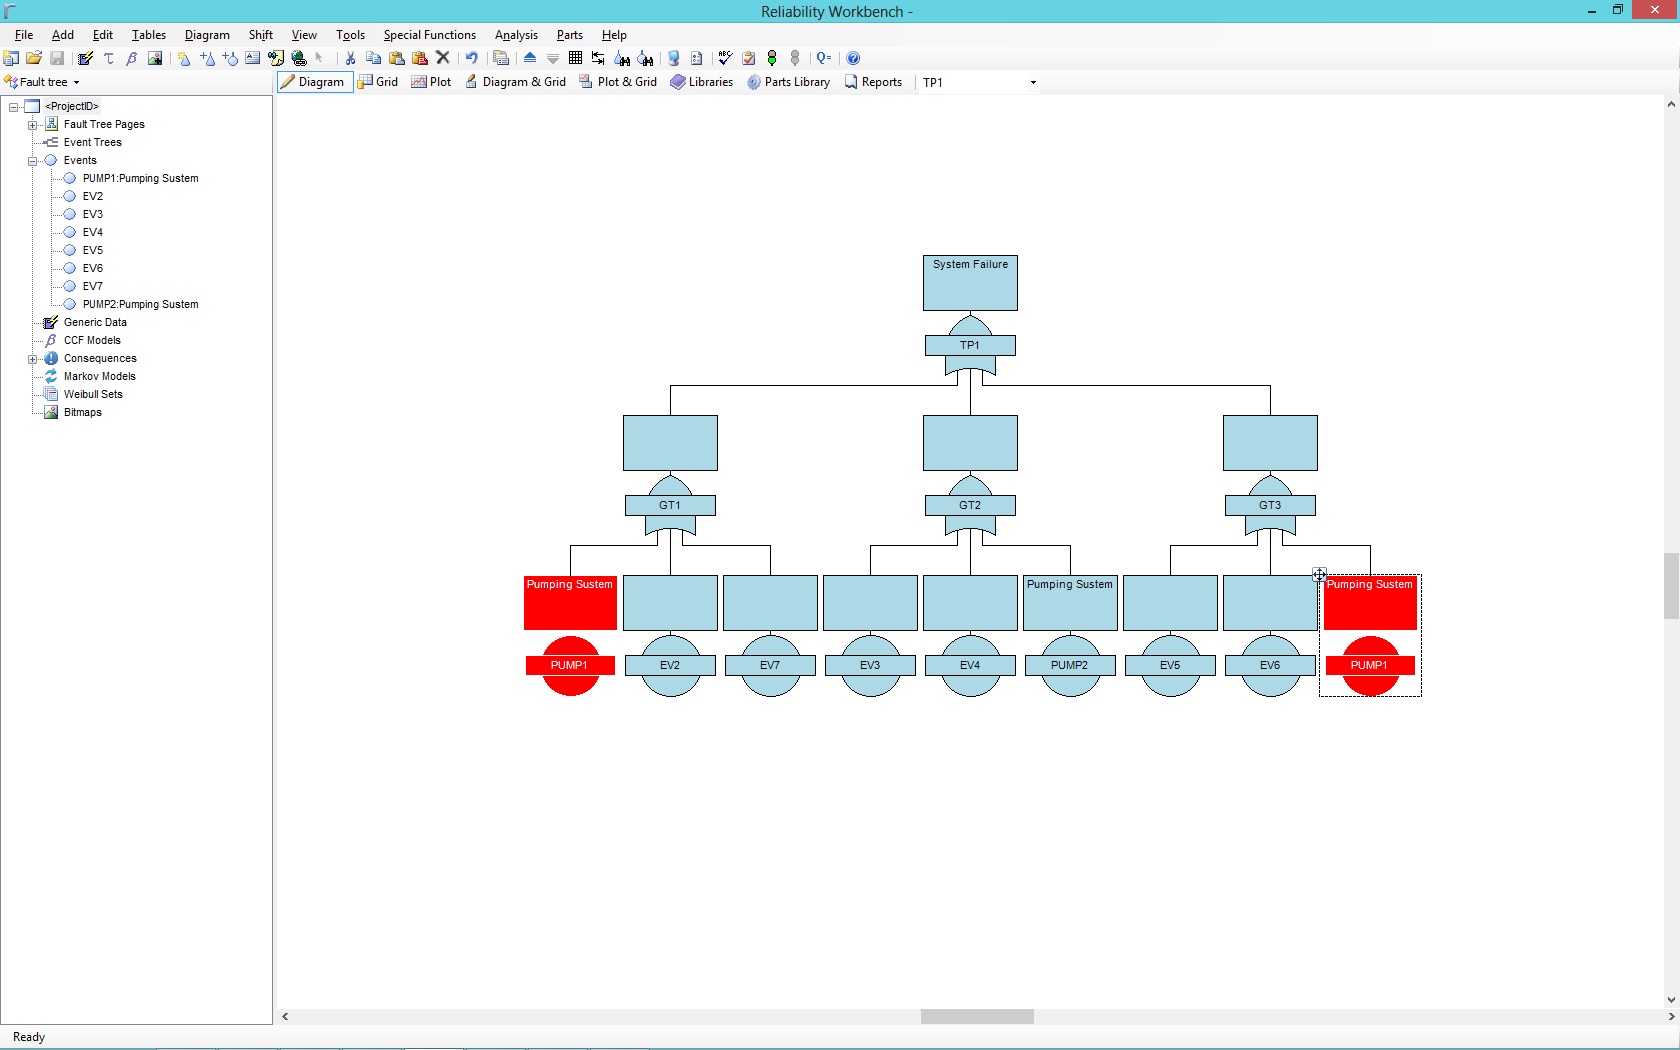
Copying and Pasting a gate or event will cause the same gate or event to appear in different parts of the tree. Pump1 will be our example, if we Copy and Paste Pump1 from gate GT1 and paste that pump under gate GT3. Pump1 would now be listed under 2 separate OR Gates.
As you can see in the example below the event named Pump1 has been Copied and Pasted under gate GT3. The event Pump1 has the exact same name in both events making Pump1 a CCF. Using Copy and Paste is representing the same event in two different branches of this fault tree.
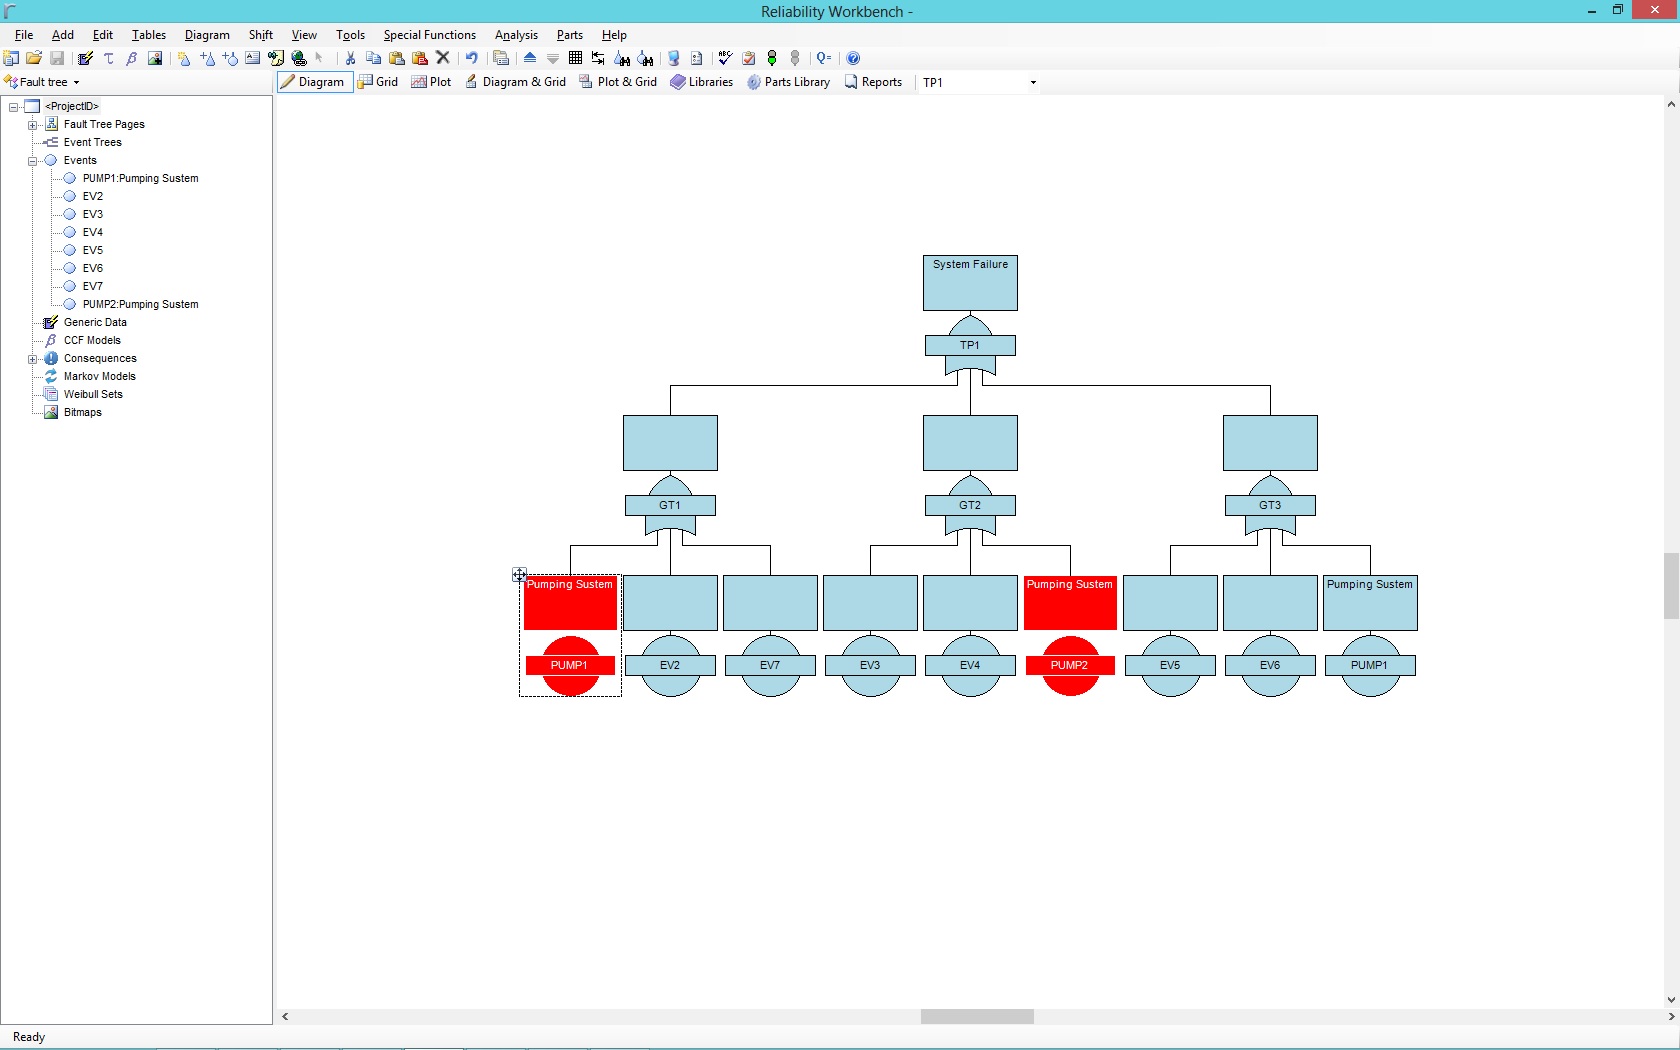
Copy and Paste Special on the other hand creates a copy of Pump1. This is not the same event but an identical event. As you will see below I have used Copy and Paste Special to add a copy of Pump1 under gate GT1 to gate GT2, the new identical pump is named Pump2 not to be confused with the event Pump1 under gate GT1 and GT3 . Pump2 is an identical in every way to Pump1 but is not the same pump. In this case Pump2 would not create a CCF. Please note that when using Paste Special the software has automatically renamed event Pump1 to Pump2. The new gate or event can use any naming convention you would like as long as it is not the same name as an existing event. When 2 gates or events have the exact same name the software recognizes those gates or events as the same gate or event.
Tech Tuesday: The Grid Control
Howdy, folks. This will be the first installment of what we hope will become a regular feature around here. Each Tuesday, look for an article highlighting a technical aspect of our software. This may be a demonstration of a feature, an explanation of the mathematics that power the tools, or some comments on technical support questions that we're frequently asked.
Today, I'll be talking about the Grid Control feature of our Availability Workbench and Reliability Workbench tools. If you've used our AvSim or FaultTree+ software, you know the power of the tool, and the usefulness of the diagram view to be able to create and edit intricate Fault Tree or Reliability Block Diagrams (RBDs). However, sometimes you may find that you have to do some task, such as text entry, or finding and replacing some information, that can be cumbersome to perform in the diagram view.
For instance, suppose you've created a large, multi-page Fault Tree, and now you want to add unique IDs and descriptions to all the gates and events, so you can identify what each one represents. To do this in the diagram view, you'd need to locate each item individually, double-click to open the Properties dialog for the gate or event, set the ID and description, click "OK" to close the dialog, find the next item, rinse, and repeat. There's a lot of back-and-forth between mouse and keyboard, and hunting through the diagram for the items you want.
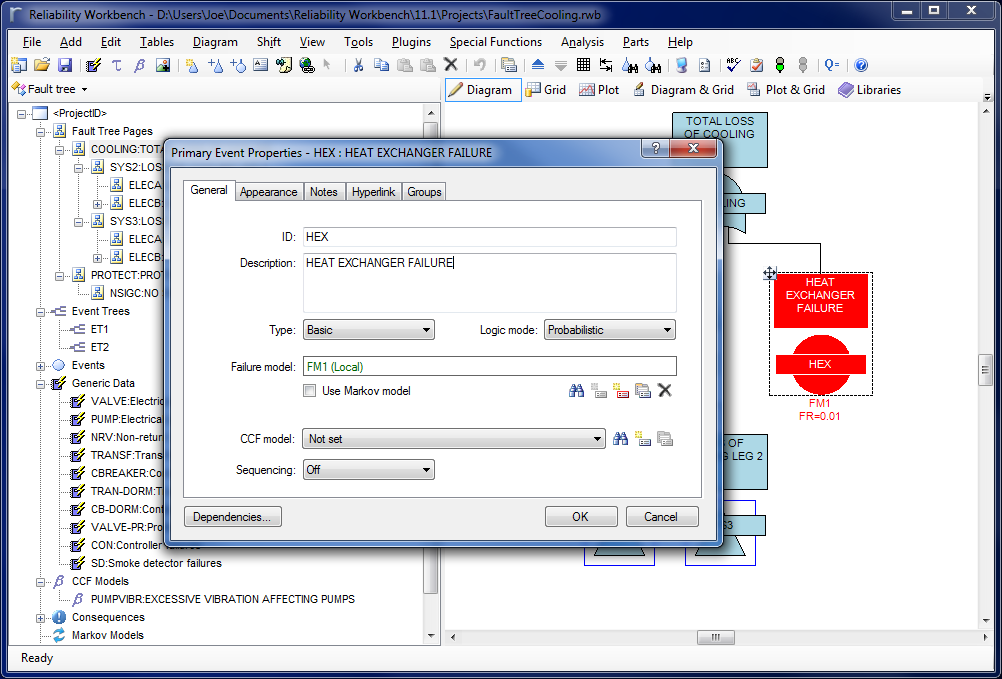
The Grid control helps with this by providing a tabular format for editing data, similar to what you'd see in Microsoft's Excel or Access products. Each gate or event appears on one line of the grid, and you can use the cursor keys, or the tab key, to navigate the records and fields. To edit some text, simply highlight a field with the mouse or keyboard and start typing, or press Enter on your keyboard.
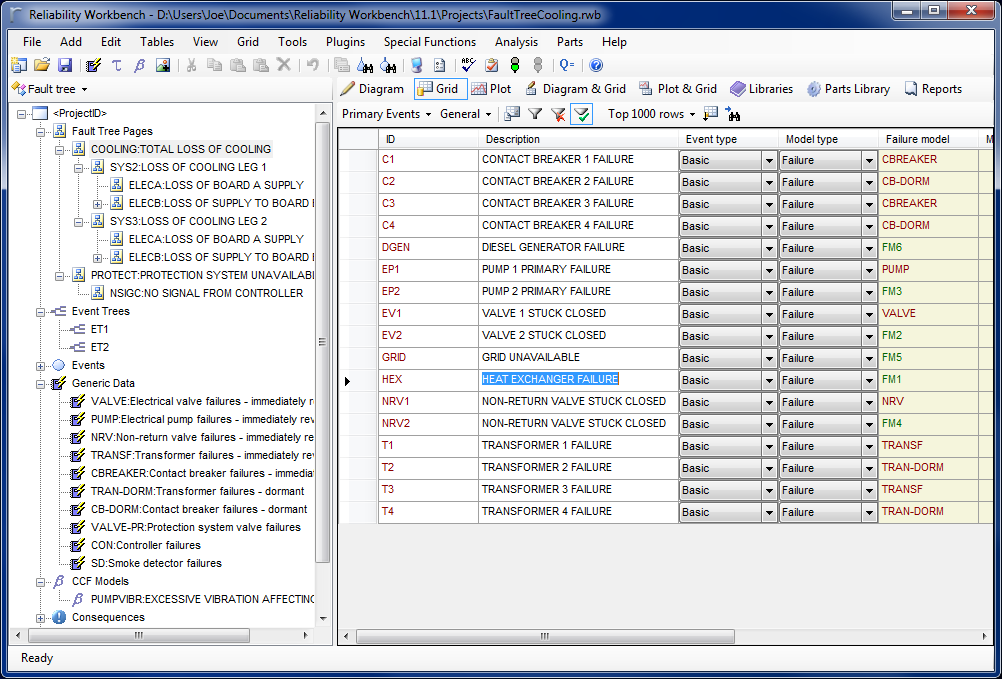
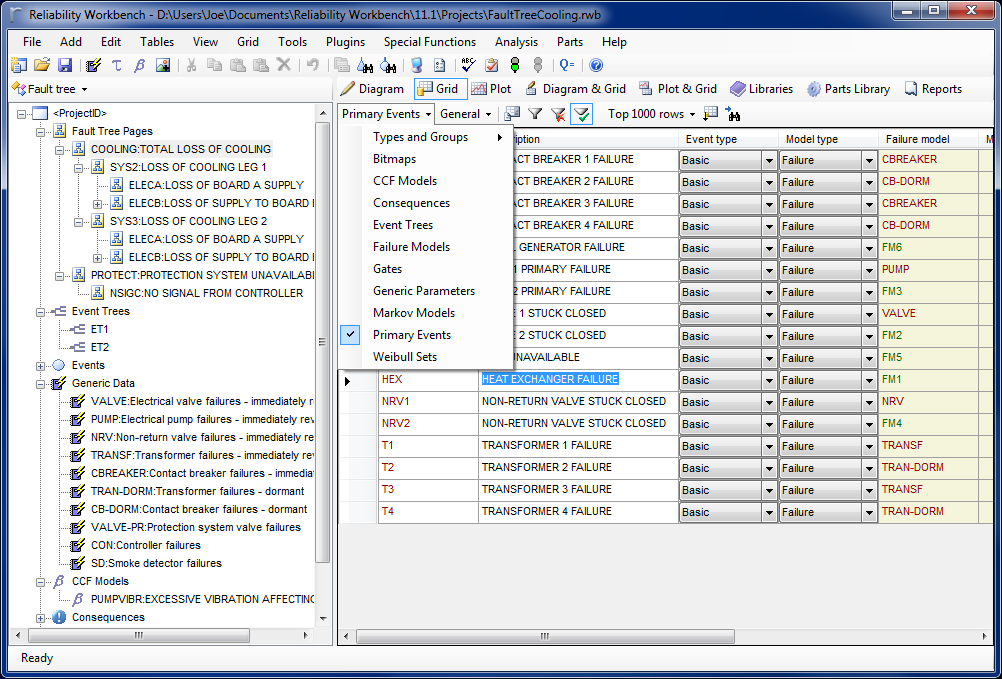
From the grid view, you can use the table selector to choose which data you want to display. This might be the Gates, Events, or Failure Models table in FaultTree+ , or the RBD Blocks or Failure Models table in AvSim.
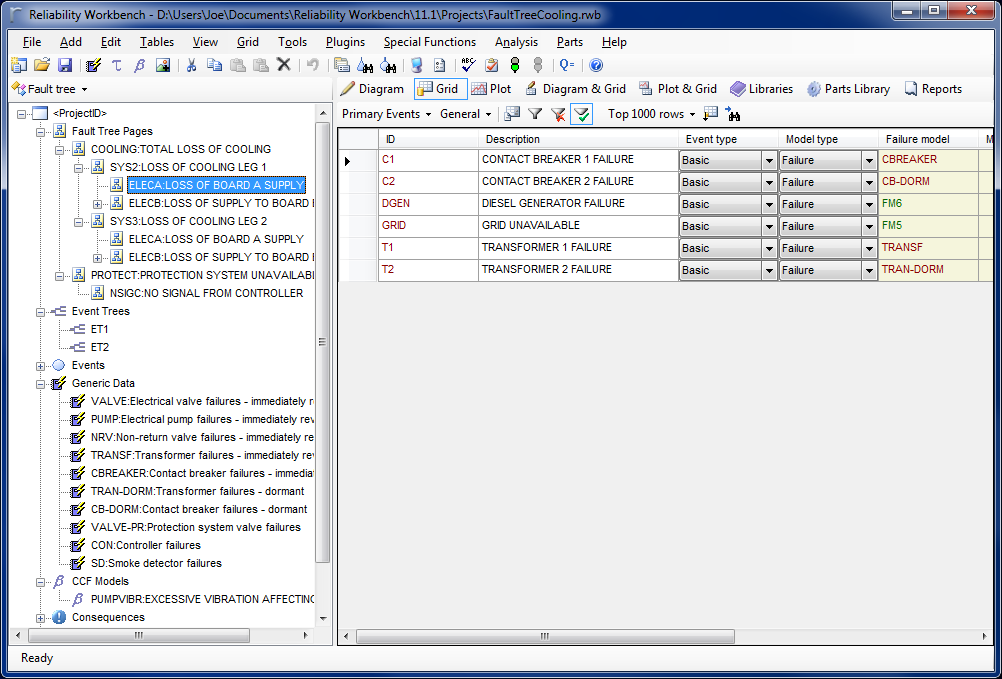
With a given table selected, you can refine which records should be displayed by using the "Filter Grid by Tree Control Selection" option, found in the Grid menu. This mouthful-of-a-name simply means that data will only be displayed in the Grid if it's relevant to the selection in the tree control on the left hand side. For instance, selecting a particular gate in the Fault Tree hierarchy will only show events under that gate, or selecting a Failure Model group in the AvSim project will only display failure models in that group.
There are plenty more options in the Grid view that allow you to choose what data is displayed. You can use the Grid Layout options to choose what columns should be displayed, and what their order should be; the Grid Filter provides further methods of filtering records; and the Grid Sort allows you to choose how the records are sorted. And any custom grid layout, filtering, or sorting you've created can be saved, so you can share it with your colleagues or transfer it to a new computer. You can even copy and paste data directly from the Grid view to a spreadsheet application like Microsoft Excel.
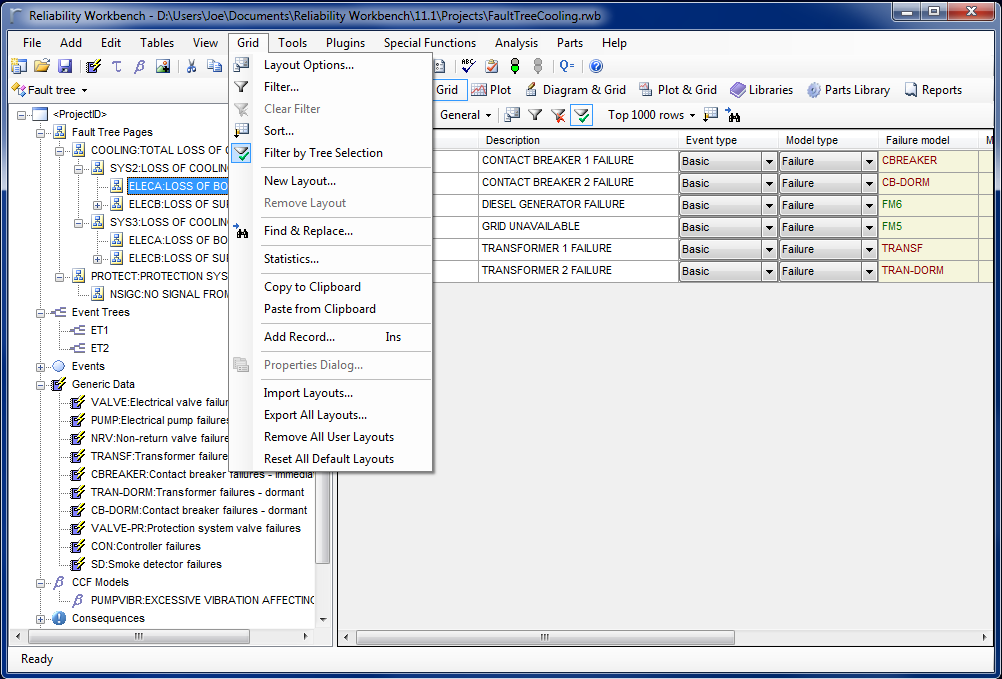
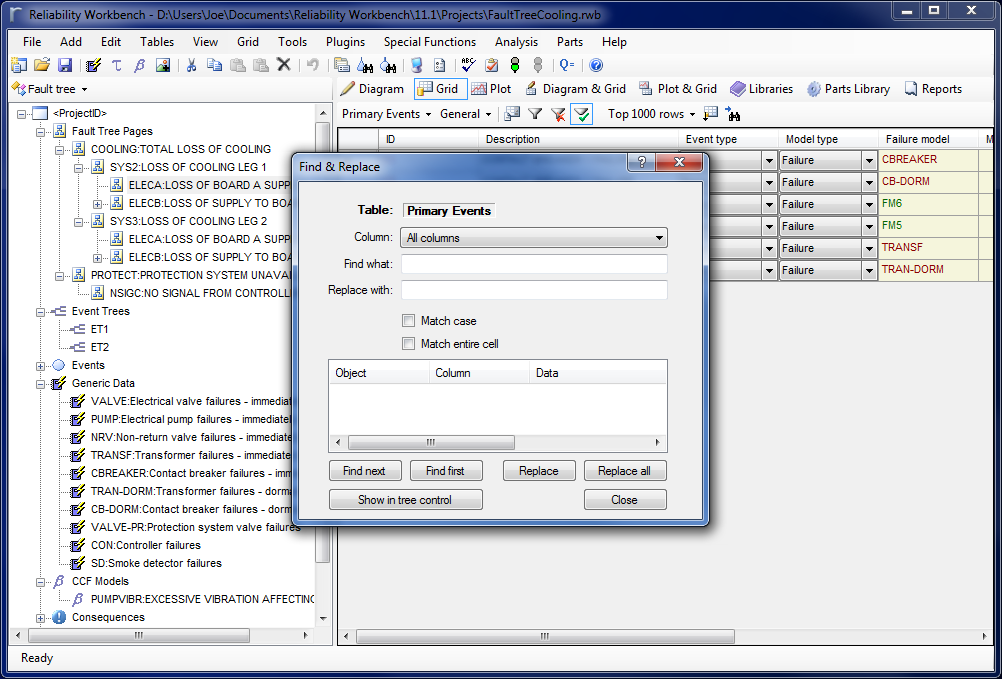
There's even a Find & Replace feature, for when you need it. The cool part is, when you use Find & Replace, it will only apply to the currently-displayed records. If you use a filter to hide certain rows, they won't be included in the replacement.
And for those times when you want the Properties dialog, you can just double-click the grey space to the left of a grid row to open the Properties dialog for the item.
Why don't you take a look at the Grid control, and try it out? I've found it to be a great tool to use when quickly building or editing a project.
