The reliability prediction module enables you to predict failure rates for a set of components under given conditions. The data may be drawn from a selection of industry-standard handbooks such as MIl-HDBK-217, 217 Plus, Telecordia, IEC TR 62380, FIDES, SN 29500, IEC 61709 and NSWC.
What's in the Reliability Prediction Module?
The prediction module provides you with a powerful visual interface through which you can select components and define the conditions in which they operate such as the temperature or environmental conditions. The prediction software automatically carries out the failure rate calculation as defined by the standard and provides you with the results.
What Industry Standards are Included?
The Reliability Workbench Prediction module includes the following standards:
- Telcordia SR-332 Issues 2 and 3
- MIL-HDBK-217
- Quanterion 217 Plus
- IEC TR 62380 (RDF 2000)
- NSWC handbook
- GJB/z 299B and 299C
- Siemens SN 29500 / IEC 61709
- FIDES
How do I use RWB Prediction?
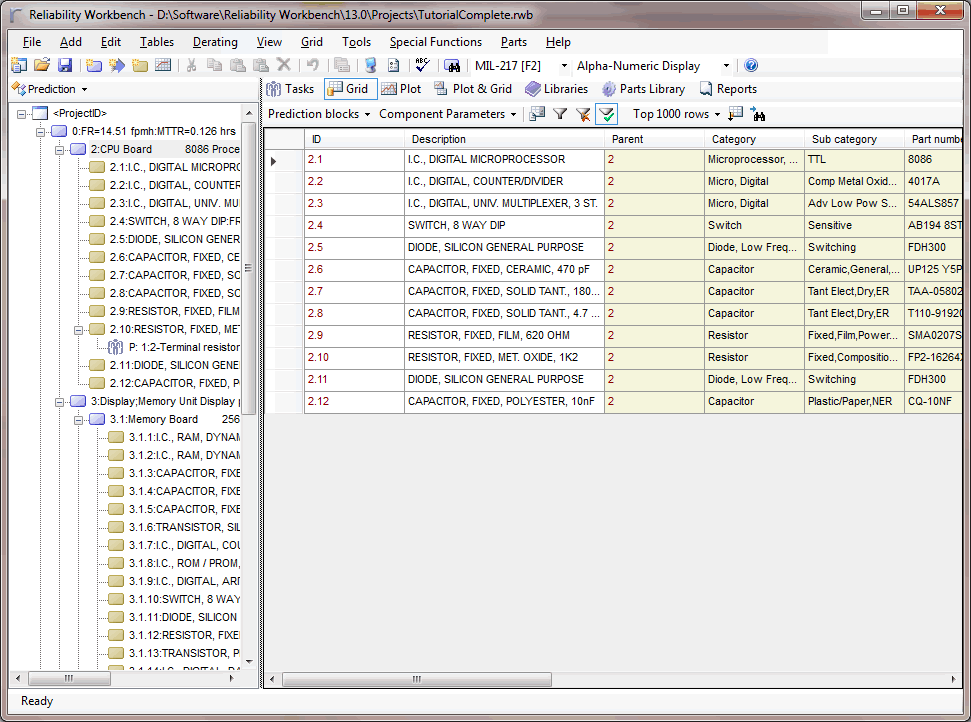
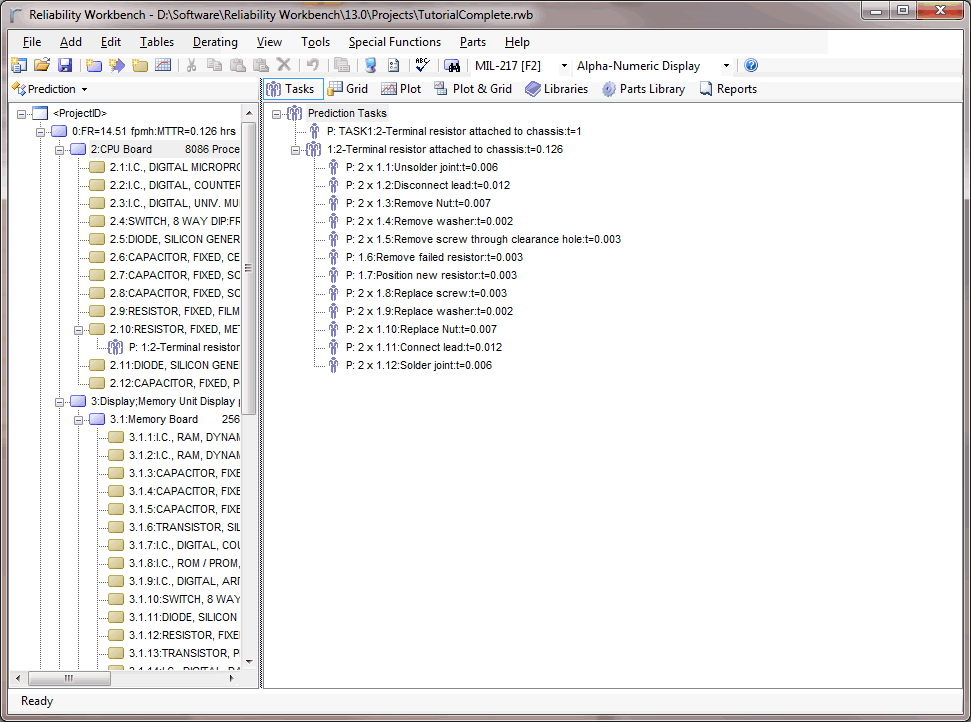
The components that make up a system can be defined in a tree structure. The tree may be composed entirely of components or it could be subdivided into blocks each of which could hold other blocks or components.
The failure rate model for each component is made up of a base failure rate for that particular type of component and multiplying factors known as pi-factors. These factors depend on the operating conditions experienced by the component. You can input these conditions through simple dialogs and default parameter values are provided.
The failure rates of components are calculated immediately and displayed on the tree diagram. The contributions of components failure rates to blocks and systems failure rates are also displayed. You can examine the effects of stresses caused by the various environmental conditions by displaying the base failure rates and pi-factors for each component.
What else can Prediction do?
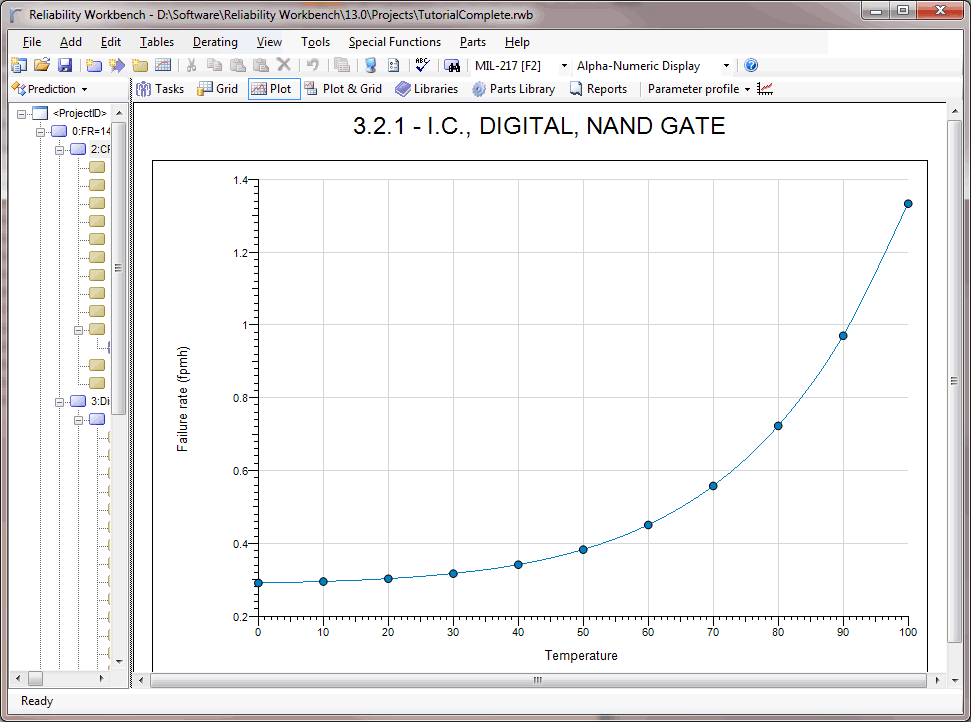
A powerful graphing facility can display the variation of predicted failure rates with ambient temperature, stress and environment settings for an entire system or individual blocks and components.
You can cut, copy and paste in the diagram to make rapid changes. Commonly used components can be entered once in a library and then pulled into the project tree each time that the component is used.
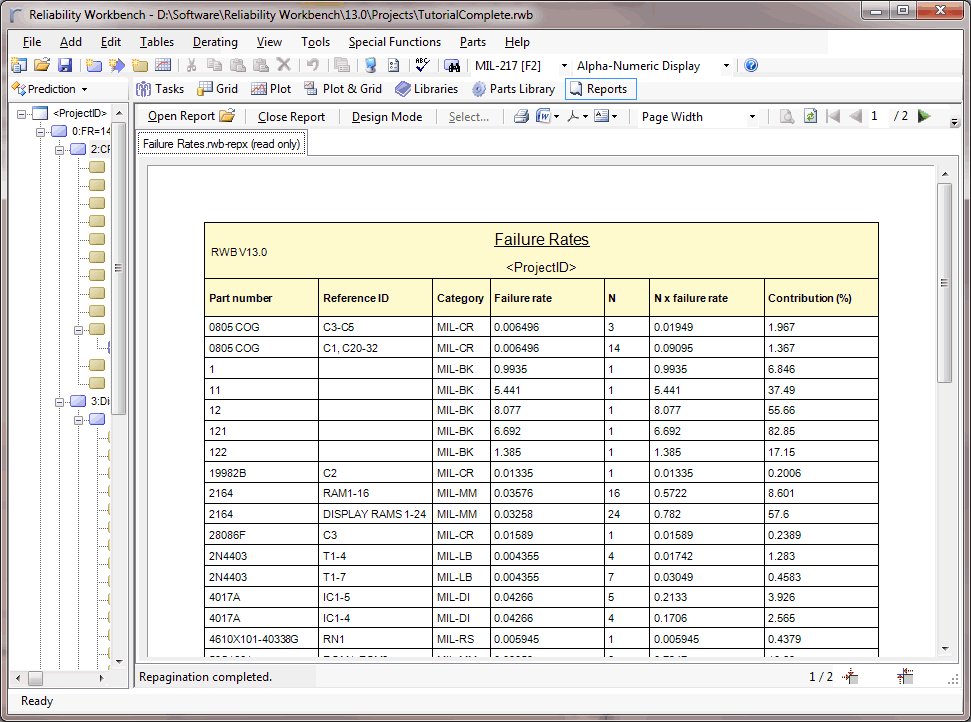
Information can be imported from Excel, Access, SQL Server, Oracle and other formats. Powerful reporting and features allow you to create professional standard reports at the click of a button.