The Reliability Growth module of Reliability Workbench analyzes test data by calculating scale and shape parameters that define a growth curve that fits the data. The scale and shape parameters can be used to calculate failure intensity, Mean Time to Failure (MTTF), or Unreliability at an arbitrary time. This allows a user to determine whether there is an improving or worsening trend in the reliability of a system.
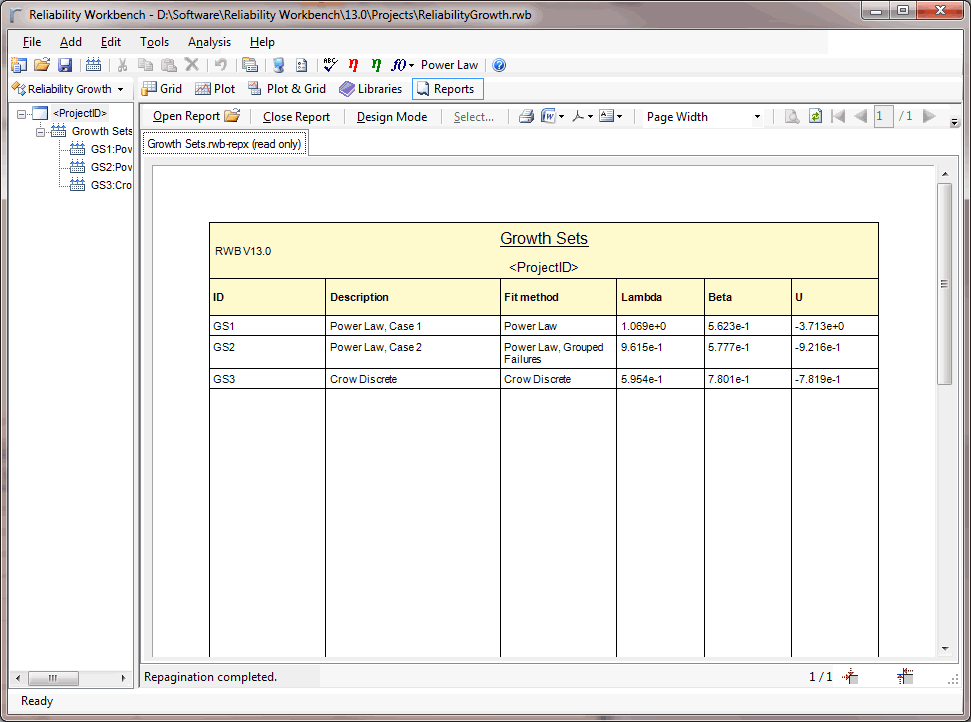
The Reliability Growth module can match a curve to continuous or discrete test times, based on one of the following methods:
- Power Law
- Power Law (grouped failures)
- Crow Discrete (Power Law for discrete data)
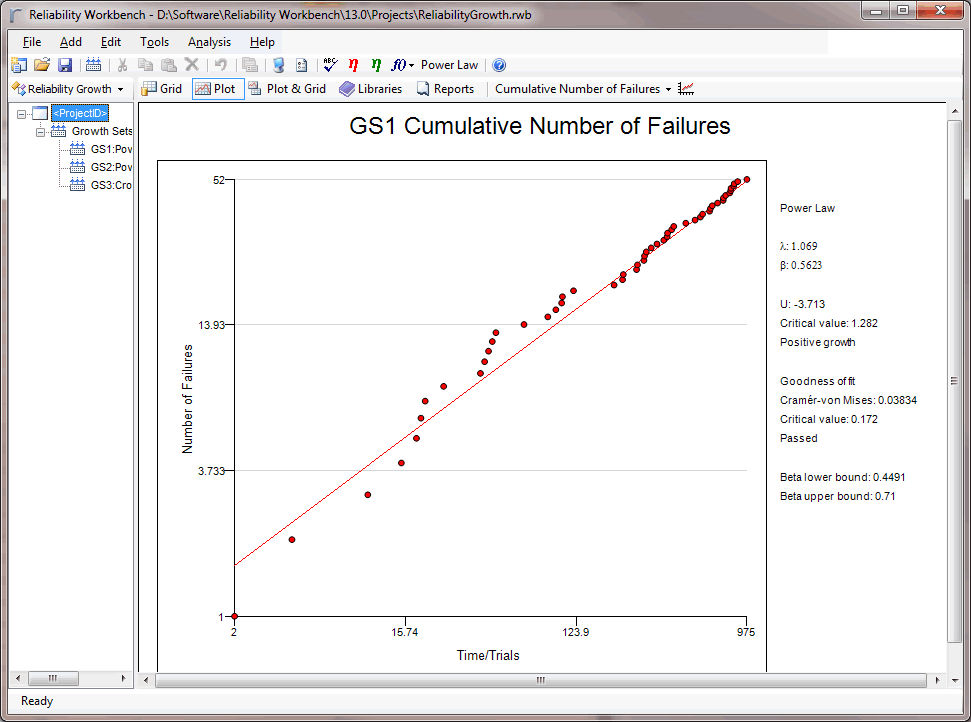
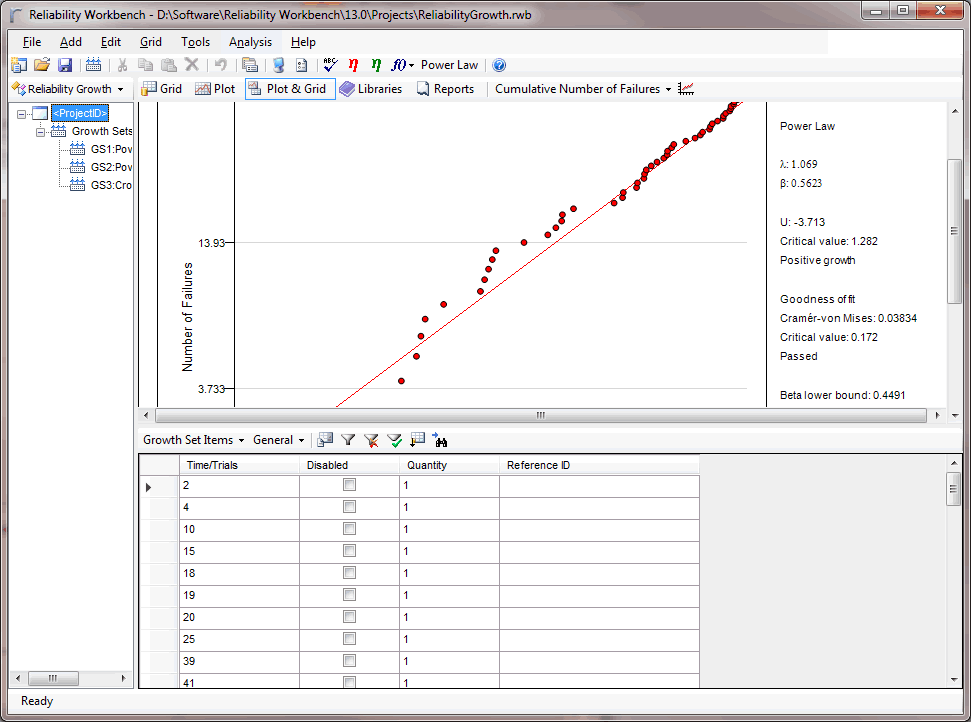
Reliability Workbench automatically fits a curve to the data according to the chosen method and displays the results graphically in the form of cumulative number of failures plots, failure intensity plots, MTTF plots, and Unreliability plots.
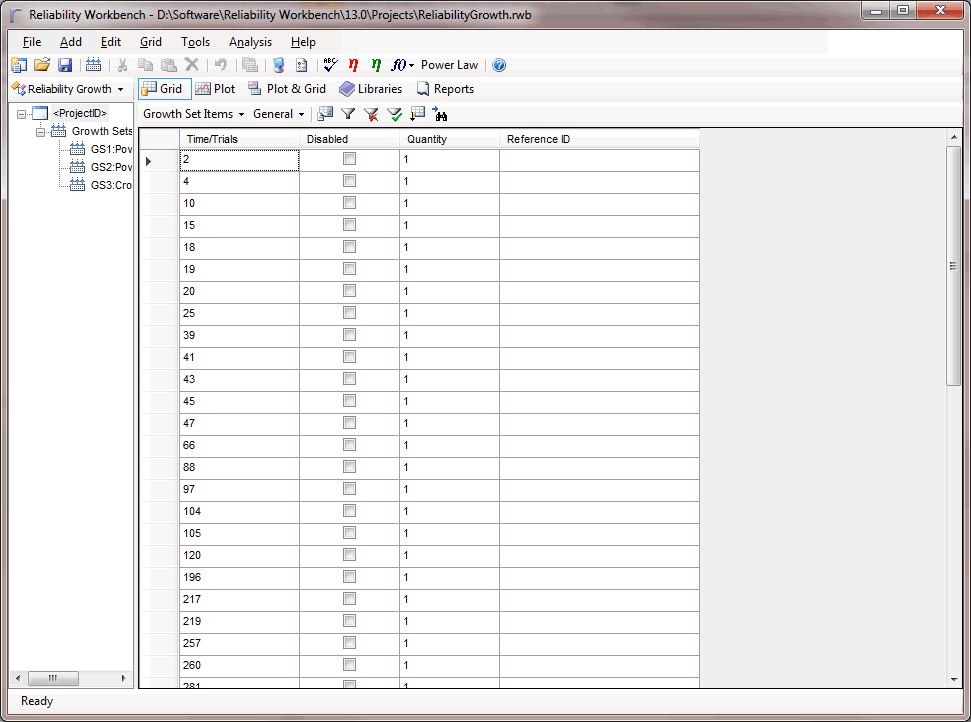
Data may be entered manually by the user or imported from other packages or transferred via the Windows clipboard.
New data can be analyzed in 3 simple steps:
- Enter or import the data
- Choose the appropriate calculation options for the data
- Assign the appropriate Growth method